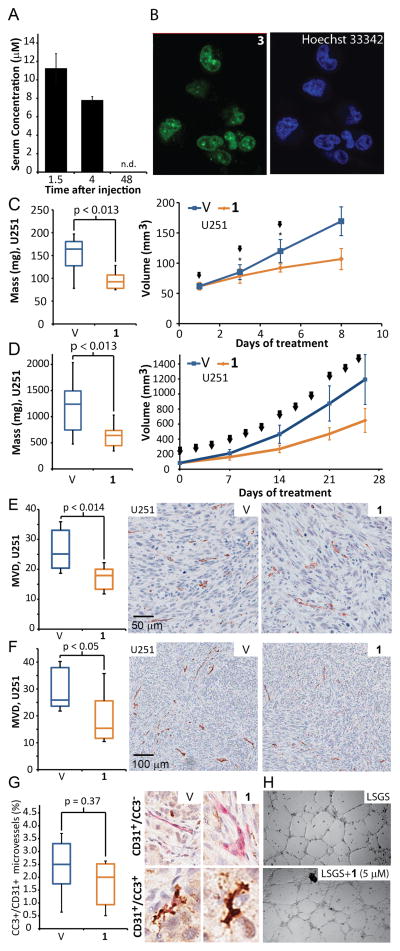
Figure 2. Polyamide 1 inhibits tumor growth and vascularization after systemic administration.
A) Serum concentration of 1 after subcutaneous injection. The C57BL6 mice were injected with 1 subcutaneously into interscapular area, after which we drew blood via retroorbital collection (n=4 per time point). B) Nuclear uptake of 3 in U251 cells, counterstained with a DNA-binding Hoechst 33342 fluorophore. C) Final masses and growth curve of s.c. U251 xenografts derived from animals subjected to Schedule A (n=7,8, for vehicle and treated groups; for volumes, measurements at the 3rd an 5th day contain 5 data points.) D) Final masses and growth curve of U251 xenografts (Schedule B, n=10 per condition). E) Mice harboring xenografts were treated with 1 according to Schedule A and their MVD score was measured using anti-mouse CD31 immunostaining of tumor sections (For U251 n=7,8 for vehicle, and treated groups). F) Prolonged treatments, according to Schedule B in U251 xenografts led to comparable decrease in MVD. G) Apoptosis in blood vessels was determined by double-staining of Cleaved Caspase-3 (CC3) and mouse CD31 of GBM39 tumor sections treated according to Schedule C. Both vehicle and polyamide-1 treated samples exhibited low levels of blood vessel apoptosis and the differences between the groups were not significant (p=0.37, n=5 per condition). H) An in vitro angiogenesis assay - matrigel tube formation assay using HUVECs - shows treatment with 1 (5 μM) over 48h has no effect on endothelial tube formation. Arrows denote injections. Error bars are 95% CI for growth curves and minimum-maximum for other graphs.

