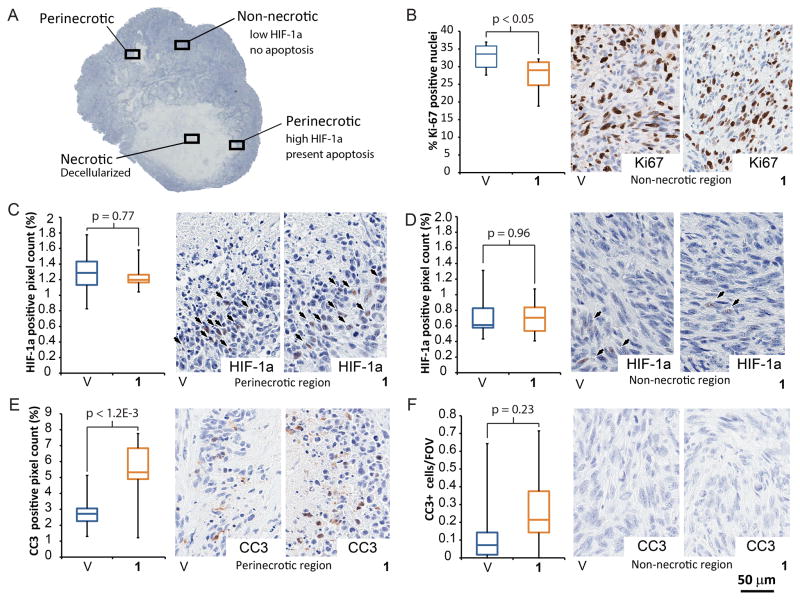
Figure 3. Treatment with 1 decreases tumor proliferation, induces apoptosis in HIF-1a positive areas and does not lead to HIF-1a accumulation.
A) Regions used for local analysis in U251 tumors (Schedule B treatment). All analysis was done at 20× magnification, perinecrotic area contained 50% necrosis and 50% adjacent, non-necrotic area, as shown. B) Treatment with 1, induced a modest, but statistically significant decrease in proliferative index (Ki-67 staining). C) The non-necrotic region exhibited low numbers of HIF-1a positive pixels. D) Perinecrotic area was more positive in HIF-1a. However, there were no differences in HIF-1a levels between the treatment groups. E) Cells in perinecrotic region show significant increase in CC3 staining upon treatment with 1. F) However, non-necrotic tumor regions show no presence of apoptosis. For each measurement n=10, per condition. Error bars denote minimum and maximum.

