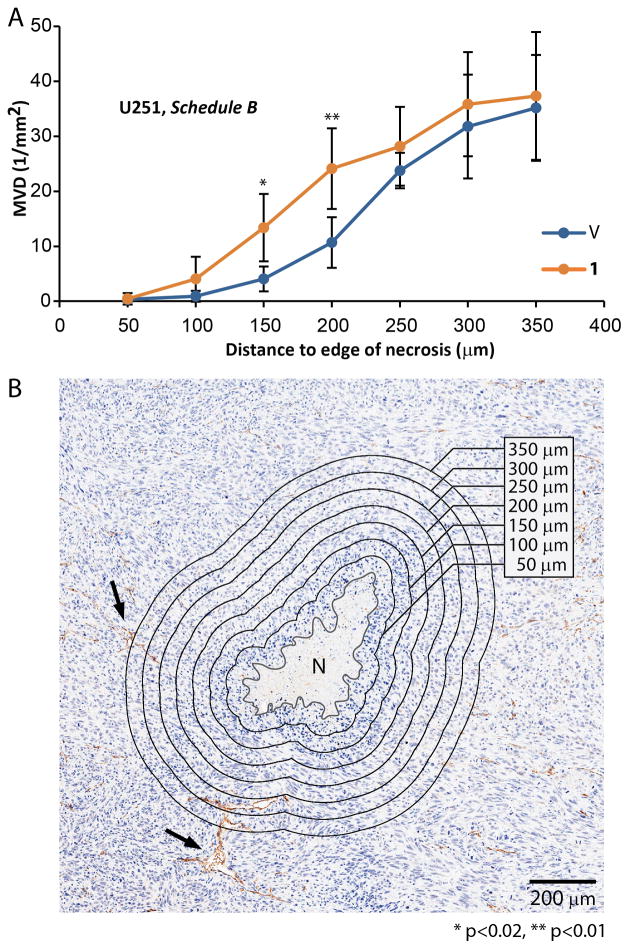
Figure 4. Treatment with 1 increased reliance of tumor cells on proximity to vasculature.
U251 cells with impaired adaptation to hypoxia are more sensitive to low oxygen pressures. Necrosis can form in the areas with inadequate oxygen supply, typically at a distance of ~ 200 μm (oxygen diffusion limit in tissue) from blood vessels. As the oxygen pressure is dependent on the blood supply and necrosis is dependent on the oxygen pressure, the density of blood vessels around necrosis is an indirect, phenotypic, endpoint of hypoxic adaptation that is highly quantifiable. To measure the degree of hypoxic adaptation impairment upon the treatment with 1, necrosis was delineated manually and zones were offset every 50 μm. Number of blood vessels per area was calculated for each zone and converted to MVD. A) Group treated with 1 shows higher MVD in perinecrotic areas - within 150 and 200 μm from the edge of necrosis. B) Example of necrosis along with delineation and zonal analysis of MVD. (n=10 tumor per condition, 854 total microvessels measured for a group treated with 1 and 586 for a group treated with vehicle). Arrows denote two of the large microvessels, N denotes necrosis. Error bars denote 95% CI.

