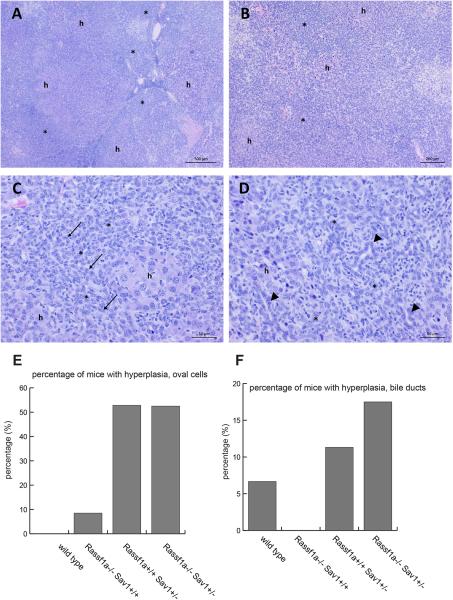
Figure 2. Characterization of liver tumors.
A-D. Liver tumor from a Sav1+/+ Rassf1a−/− mouse. Low magnification photomicrograph demonstrating multinodular “mixed” type tumor (panel A). Areas with obvious hepatocellular morphology (h) are intermixed with areas having “small cell” morphology (*). This is shown at slightly higher magnification in panel B. At still higher magnification (panels C and D), the “small cell” component (*) of the mixed tumors is found to be composed of cells that have oval to occasionally round or elongated nuclei (panel C; arrows) and vary from having no organization (panel C) to well-defined (panel D) orientation into rows or duct-like structures (panels D; arrowheads). Areas of obvious hepatocellular morphology are labeled (h) in panels C and D. H&E staining. E. Percentage of mice with oval cell hyperplasia of the liver. F. Percentage of mice with bile duct hyperplasia.

