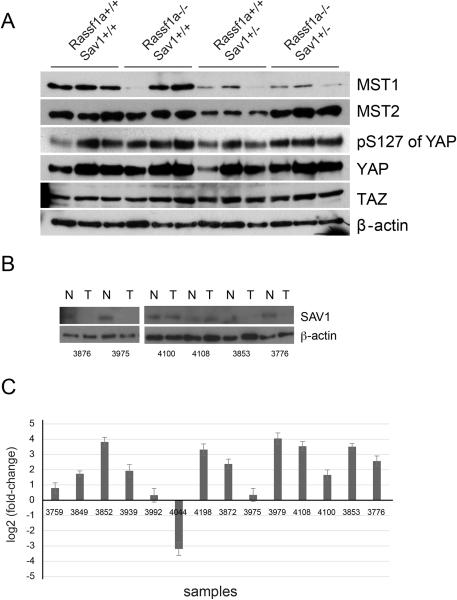
Figure 3. Analysis of Hippo pathway components.
A. Western blot of Hippo pathway components in liver lysates of 6-month old mice of the different genotypes. Each lane represents a sample from an individual mouse. B. Reduction of SAV1 protein levels in liver tumors developing in Rassf1a+/+ Sav1+/− mice. C. Expression differences of the YAP target gene Ctgf between liver tumors developing in Rassf1a+/+ Sav1+/− mice and adjacent normal liver in the same mice. The expression data were normalized relative to Gapdh expression. All tumors were HCC except tumors 3852, 3872, 3939 and 3979, which were adenomas.

