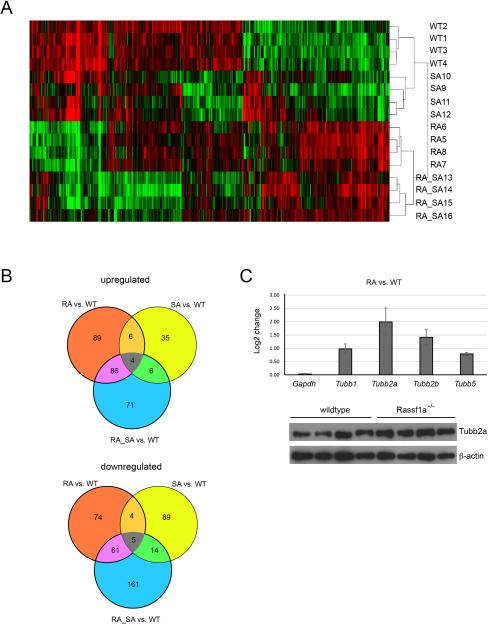
Figure 5. Gene expression differences in livers from mice with Rassf1a and/or Sav1 deletion.
A. Heat map showing differentially expressed genes in livers of 12-month old mice with genotypes Rassf1a+/+ Sav1+/+ (WT), Rassf1a+/+ Sav1+/− (SA), Rassf1a−/− Sav1+/+ (RA) and Rassf1a−/− Sav1+/− (RA_SA). Samples with the same genotype cluster together.
B. Venn diagram showing differentially expressed genes (P<=0.005), up- or downregulated, in the livers of the three knockout genotypes versus wildtype liver.
C. Differences in expression levels for the beta tubulin genes Tubb1, Tubb2a, Tubb2b and Tubb5 as determined from the microarray data. Levels of TUBB2A protein in wildtype and Rassf1a−/− Sav1+/+ mouse livers were assessed by Western blot using beta-actin as a control. Each lane represents a sample from an individual mouse.

