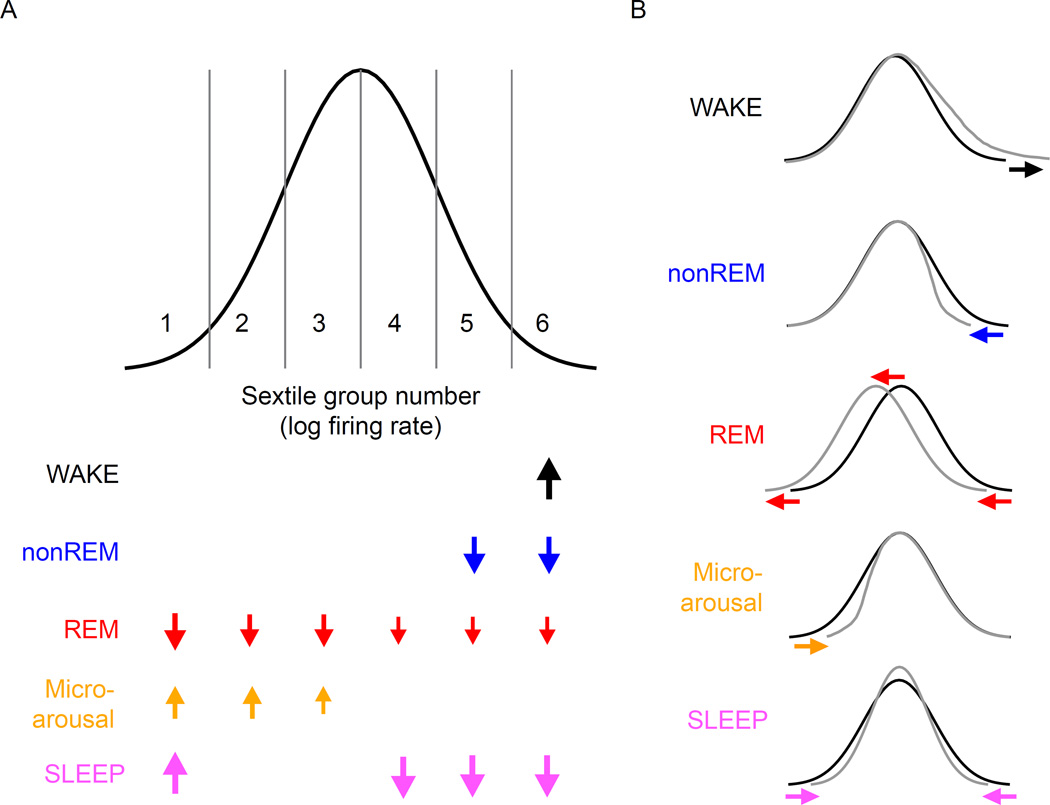
Figure 6. Effects of brain states on neural firing rates.
Idealized distribution of the log firing rates of cortical neurons, divided into 6 sextiles to match our analyses here. Arrow size indicates the magnitude of the observed significant effects on firing rate of WAKE, nonREM, REM and microarousal (MA) states on subsequent states, based on numbers from Figure 5B. In addition, the rate changes brought about by SLEEP relative to WAKE are also shown (bottom), based on numbers from Figure 3E. Note that the overall effect of SLEEP is mimicked by the combination of the contributions of multiple sub-states of sleep. Right panels illustrate the impact of brain states (color-coded) on the idealized distribution of population firing rates.

