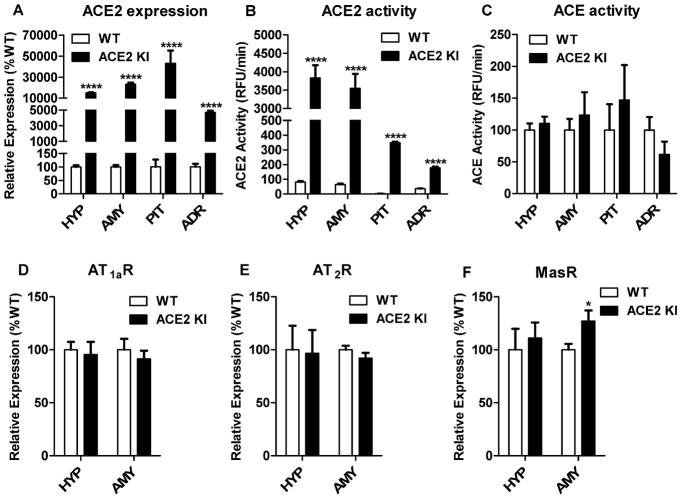
Figure 1. ACE2 KI mice robustly express ACE2 and have increased MasR mRNA in the amygdala.
(A) Levels of ACE2 mRNA expression and (B) ACE2 activity in central and peripheral tissues. (C) ACE activity in central and peripheral tissues. Levels of mRNA expression for (D) AT1aR, (E) AT2R, and (F) MasR in the hypothalamus and amygdala. HYP, hypothalamus; AMY, amygdala; PIT, pituitary gland; ADR, adrenal gland. Bars represent mean and SEM. * = P < 0.05; **** = P < 0.0001.

