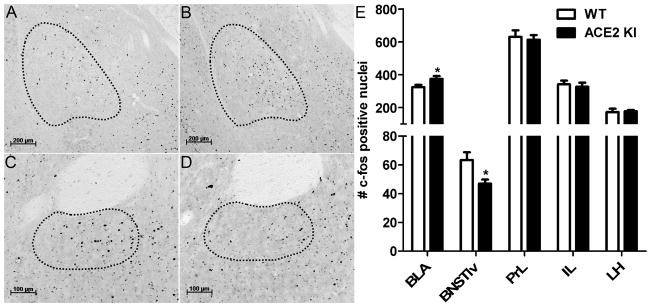
Figure 3. ACE2 overexpression alters neuronal activation after EPM exposure.
Representative immunohistochemistry images for Fos, depicted as black dots, within outlined regions of interest. (A) The BLA of a WT littermate and (B) an ACE2 KI mouse. (C) BNSTlv of a WT littermate and (D) an ACE2 KI mouse. (E) Relative to WT littermates, ACE2 KI mice have more Fos positive nuclei in the posterior division of the anterior basolateral amygdala (BLA) but have less Fos positive nuclei in the lateroventral division of the bed nucleus of stria terminalis (BNSTlv). Number of Fos positive nuclei in prelimbic cortex (PrL), infralimbic cortex (IL), and lateral hypothalamus (LH) are not different between ACE2 KI mice and WT littermates. Bars represent mean and SEM. * = P < 0.05.

