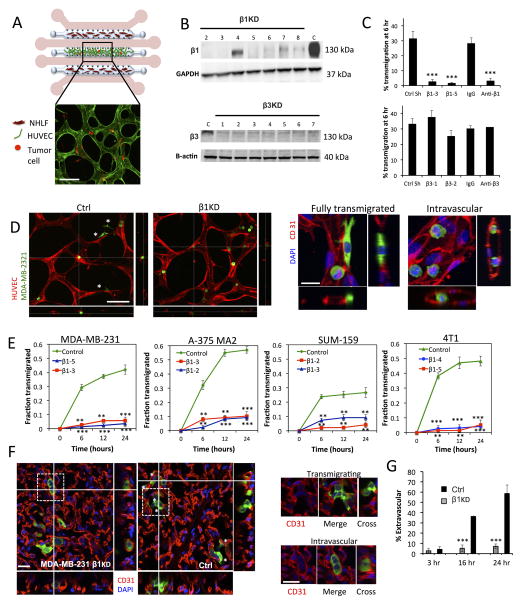
Fig 1. Knockdown of β1 integrin inhibits tumor-cell transendothelial migration in in vitro microvascular networks and in vivo extravasation assays.
(A) Schematic (not to scale) of the microfluidic device for the formation of microvascular networks. A central gel region with suspended human umbilical cord vein cells (HUVECs) is flanked by two normal human lung fibroblast (NHLF) channels. Each gel region is flanked by two media channels (pink). Representative fluorescence image of a single field of view of the device at 20X (HUVEC LifeAct; green, MDA-MB 231; red, scale bar = 100 μm). (B) Western blot of β1 and β3 integrin expression after suppression via shRNA (C=control shRNA targeting firefly luciferase). (C) Effect of β1 and β3 knockdowns and integrin function-blocking antibodies on the TEM efficiency of MDA-MB 231 in in vitro microvascular networks at 6 hours (***p<0.001). (D) Representative field of views (20X) of live microvascular networks at 12 hr after seeding of control or β1 KD MDA-MB-231 cells (HUVEC; red, MDA-MB 231; green). Asterisks indicate fully transmigrated cells (scale bar = 100 μm). Immunostaining for CD31 show distinctions between transmigrated and non-transmigrated cells (scale bar = 20 μm). (E) Differences in kinetics of TEM between β1 KD and control shRNA cells were assessed for MDA-MB-231, A375 MA2, SUM-159 and 4T1 cells lines. Fraction transmigrated in human microvascular network devices is determined at the same field of view for time points of 0, 6, 12 and 24 hr (n=3, **p<0.01, ***p<0.001, bars represent mean +/− SEM). (F) Immunostaining for CD31 (red) in mouse lungs 24 hours after injection of 0.5 million MDA-MB 231 control or β1 KD cells (green). Asterisks indicate cells scored as transmigrated (scale bars = 20 μm). Cells in white dotted boxes are zoomed in to indicate examples of intravascular and extravascular cells. (G) Percentage of transmigrated control and β1 KD MDA-MB 231 cells in mice lungs 3hr, 16 hr and 24 hr after tail vein injection (n=8 mice per condition at 3 hr and 24 hr, 4 mice per condition at 16 hr, 100 randomly selected tumor cells analyzed per mouse) (**p<0.001, bars represent mean +/− SEM).

