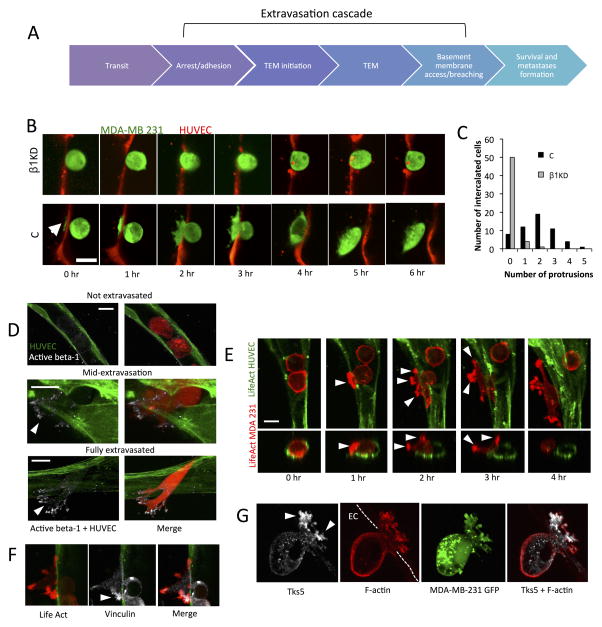
Fig 2. Activated β1 and actomyosin rich protrusion formation precede and are required for complete transmigration.
(A) Depiction of the multiple steps involved in the extravasation cascade. Circulating tumor cells arrest due to tumor-endothelium adhesion or size restriction. This is followed by onset of TEM, which may involve initiation of protrusions breaching an originally intact endothelium. After complete TEM, tumor cells may invade past the vascular basement membrane. (B) Time-lapse confocal microscopy of representative transmigrating control and β1-5 KD cells (single plane) over a period of 6 hours (HUVEC cell tracker; red, MDA-MB 231; green, scale bar=15 μm). Arrow indicates the formation of initial protrusions into the subendothelial matrix in control cells. (C) Differences between control and β1-5 KD cells in the frequency of protrusion formation in single cells during TEM at 3 hours (55 intercalated cells over 3 devices per condition were chosen randomly and scored). Protrusion number (that was definable at 30X magnification) was quantified via 3D reconstructions of single transmigrating cells. (D) Immunostaining with an antibody against the activated conformation of β1 integrin (clone 12G10, white) in microvascular networks (green) (scale bar = 10 μm). Arrows indicate localization at protrusion tips. (E) Time-lapse imaging depicting spatial organization of tumor F-actin (red) during TEM in microvascular network devices. Arrows indicates areas in protrusions where F-actin appears as punctates (scale bar = 10 μm). (F–G) Immunostaining of vinculin and Tks-5 in tumor cells during mid-transmigration past the endothelium. Arrows indicate localization of indicated proteins at the protrusion tips (scale bars = 10 μm).

