
Figure 4.
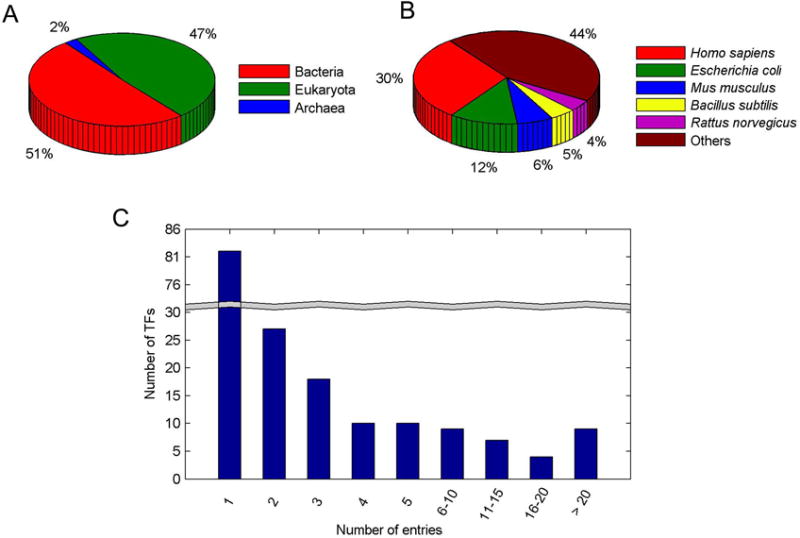
Distributions of data in the SM-TF database. (A) The distribution of TFs classified by organisms. (B) The distribution of TFs classified by species. (C) The distribution of the number of entries vs the number of the corresponding TFs.
Official websites use .gov
A
.gov website belongs to an official
government organization in the United States.
Secure .gov websites use HTTPS
A lock (
) or https:// means you've safely
connected to the .gov website. Share sensitive
information only on official, secure websites.
Distributions of data in the SM-TF database. (A) The distribution of TFs classified by organisms. (B) The distribution of TFs classified by species. (C) The distribution of the number of entries vs the number of the corresponding TFs.