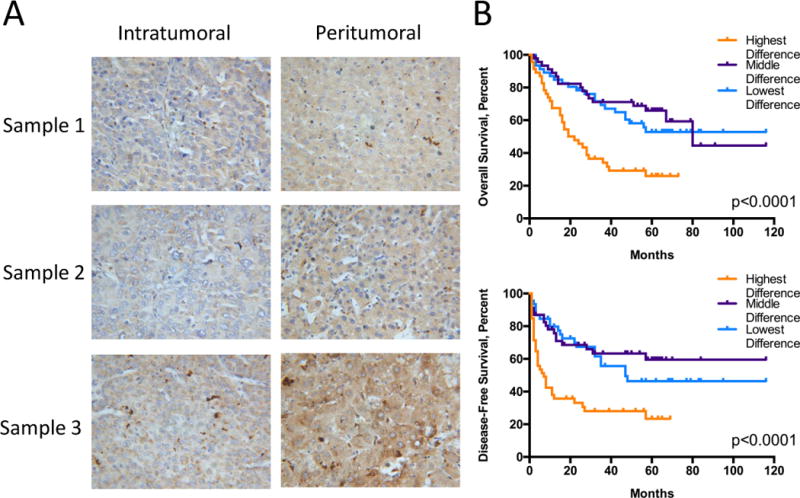
Figure 7. Differences in IL-18 expression between tumor and non-tumor tissue strongly correlate with prognosis.

(A) Representative intratumoral and peritumoral staining (400X magnification) for IL-18 from three patients. Sample 1: middle intratumoral density, low peritumoral density, low difference in staining density; Sample 2: low intratumoral density, low peritumoral density, middle difference in staining density; Sample 3: high intratumoral density, high peritumoral density, high difference in staining density. (B) Kaplan-Meier curves for overall (top) and disease-free survival (bottom) of the 138 patients stratified into the highest, middle, or lowest third of patients based on differences in IL-18 staining density (Supplementary Table S4, Supplementary Fig. S18). Statistics: (B) Log-rank Mantel-Cox tests, n=46 per group.
