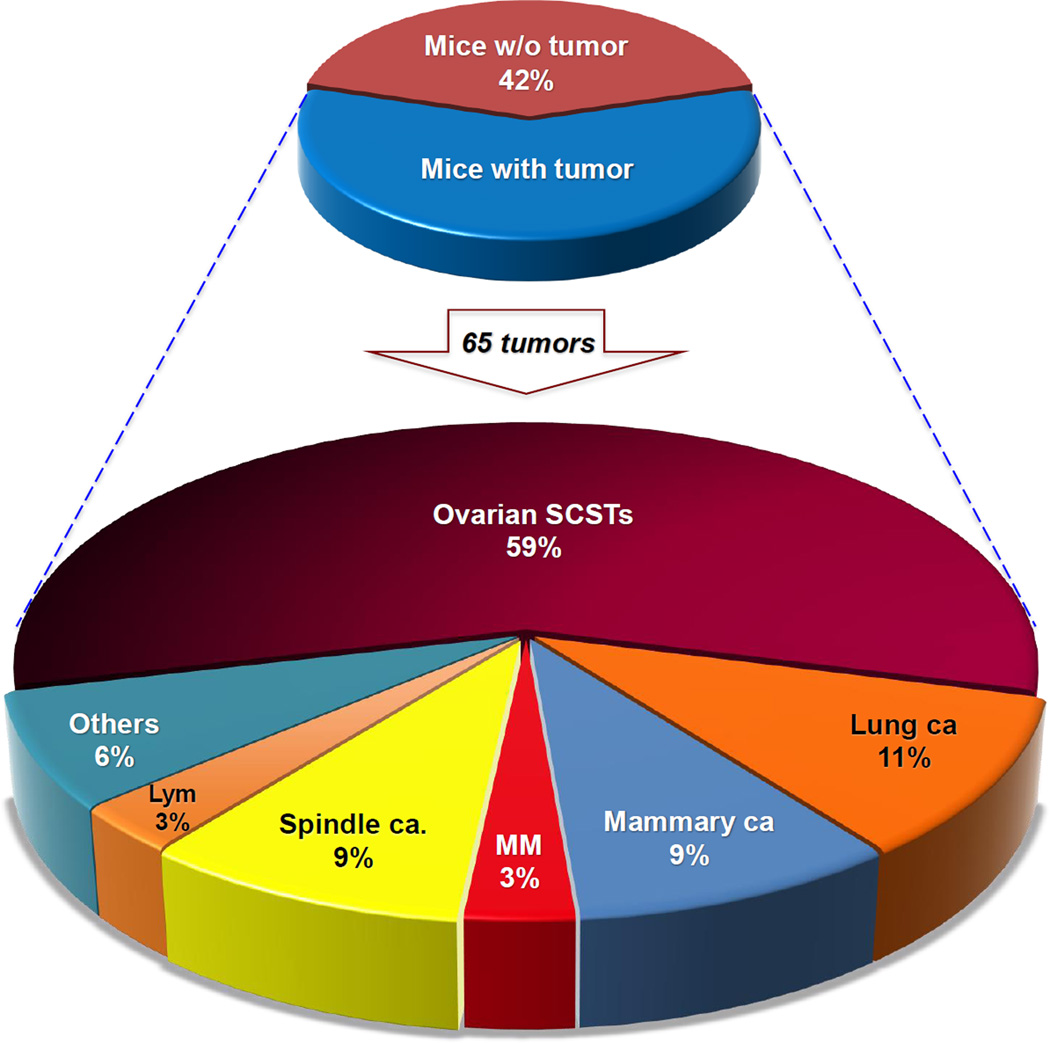
Figure 2.
Collective spectrum of spontaneous tumors observed in all three Bap1-mutant mouse models. Upper pie chart depicts percentages of mice with or without tumors. Lower pie chart indicates percentages of different primary tumors observed. Altogether, neoplastic tumors were identified in 54 of 93 (58%) Bap1-mutant mice. A total of 65 different primary tumors were found in the 54 mice, with 11 mice having two different primary tumors. Mice with bilateral ovarian SCSTs are counted here as one tumor. Percentages of different tumor types refer to proportion of all 65 tumors.

