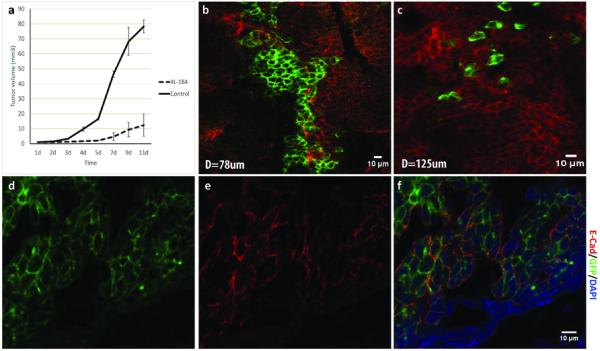
Fig 6. Imaging and quantification of Cabozantinib (XL-184) effects on EMT in vivo.

a. Tumor growth curve of the XL-184 treated mice (30mg/kg, once daily for 5 days, IP) and the PBS control group. b. A representative intravital multi-photon microscopy image of the XL-184 treated tumor. The GPF+ tumor cells were in clusters and had similar axial ratios as the surrounding RFP+ tumor cells, which was different from the sporadically distributed GFP+ cells in the control group (c). d-f. Immunohistochemistry staining of E-Cadherin in the XL-184 treated tumor. The E-Cadherin collocated with the clustered GFP+ tumor cells, indicating the epithelial phenotype of the clustered GFP+ cells.
