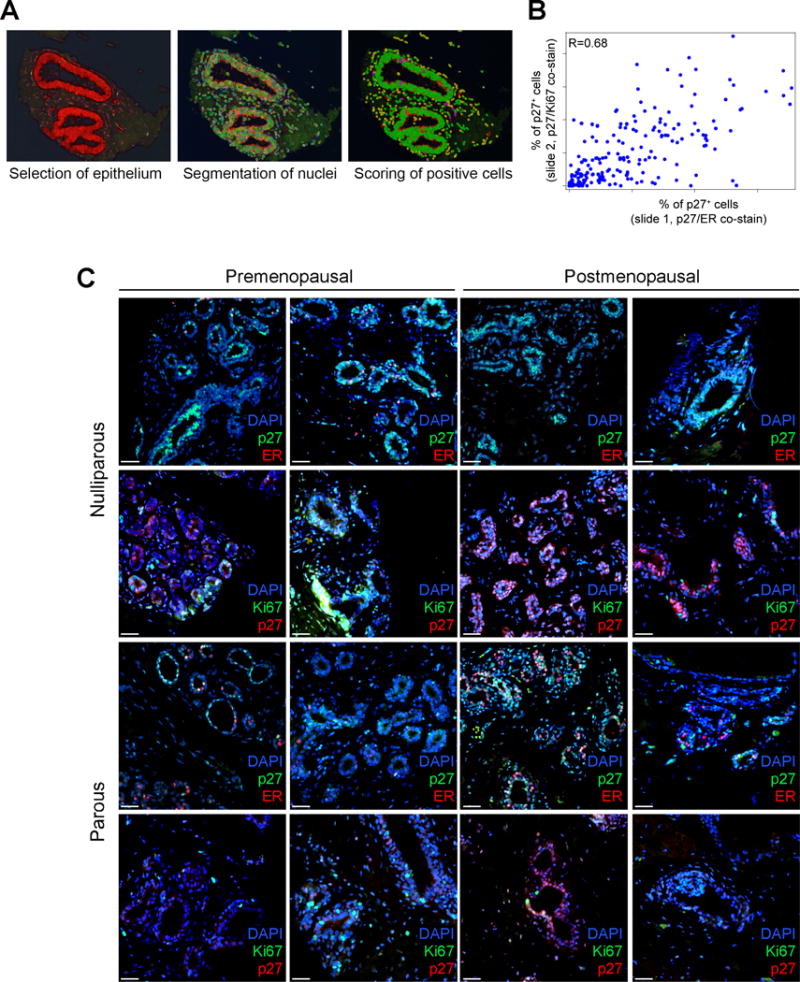
Figure 1. Imaging analysis of the normal breast tissue in the TMAs.

A, Tissue and subsequently completed cell segmentation in normal breast tissue using the inForm software. Segmented normal epithelium (red), cell (green) and stained positive cells (pink). Only cells segmented in the normal epithelium were analyzed. B, Spearman correlation between the percentage of p27+ cells on p27/ER and p27/Ki67 co-stained slides (r=0.68; N=211). C, Representative double-immunofluorescence images of staining for p27/ER and p27/Ki67 of normal breast tissues from the indicated groups of women. Nuclei are visualized by DAPI (blue) stain. Scale bar: 25 μm.
