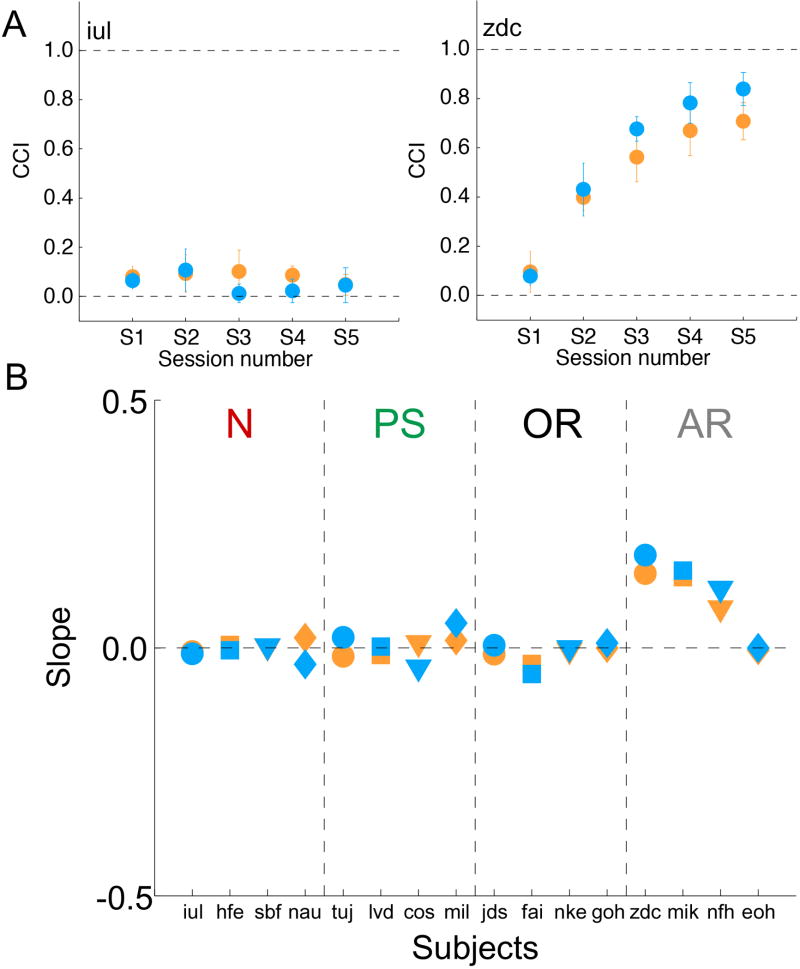
Figure 5. Experiment 1: Selection-based constancy indices across sessions.
Panel A shows examples of two distinct patterns of responses in the color-selection task. Mean selection-based indices (averaged over targets) as a function of session are shown for subjects iul (neutral instructions; left) and zdc (apparent reflectance; right). Error bars represent +/−1 SEM. Panel B shows slope for linear fits to each subject’s data across sessions. The yellowish illuminant-changed condition is shown in orange; the bluish illuminant-changed condition in blue.

