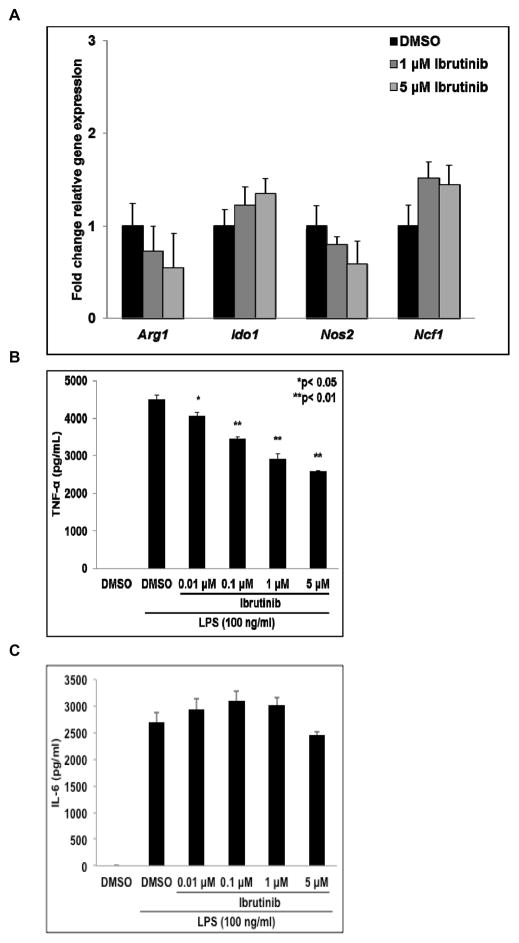
Figure 2. Effect of ibrutinib on gene expression and cytokine production by activated MSC2 cells.
(A) Effect of ibrutinib on expression of Arg1, Ido1, Nos2, and Ncf1 by LPS activated MSC2 cells. Total RNA was collected 24 hours later and expression of Arg1, Ido1, Nos2, and Ncf1 determined by qRT-PCR. Values displayed are means ± SE from three independent experiments. (B and C) After 24 hours the supernatants of cells treated as in Fig. 2A were collected and the levels of TNF-α and IL-6 were measured by flow cytometry using a cytokine bead assay. Values displayed are means ± SE from three independent experiments.

