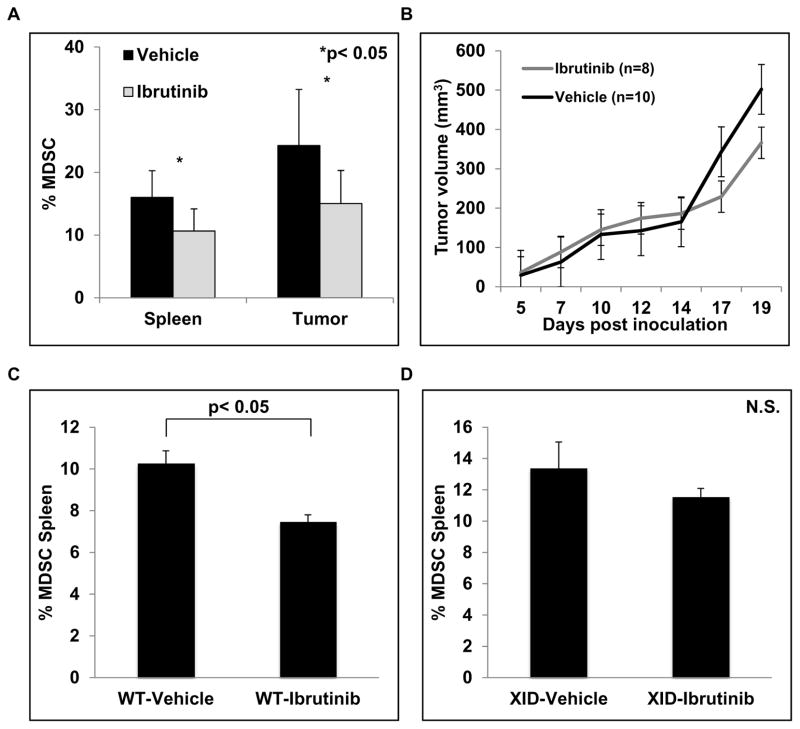
Figure 6. Ibrutinib reduces MDSC frequency in vivo.
Eight mice were included in the ibrutinib treatment group and ten mice in the vehicle control group. (A) Splenocytes and single cell suspensions of the tumors were stained with GR-1 and CD11b antibodies. Values are the mean ± SE of GR-1+/CD11b+ MDSC in the spleen and tumor, *p< 0.05. (B) Tumor volumes were measured three times weekly. Values are the mean ± SE of tumor volumes at each time point. (C) Wild type C57BL/6 mice were inoculated with 1×10⁵ B16F10 melanoma cells subcutaneously. After two weeks of treatment mice were sacrificed and the frequency of GR-1+/CD11b+ MDSC in spleen was measured by flow cytometry. Values represented are means ± SE of MDSC from 5 mice for each treatment group, p< 0.05. (D) BTK mutant C57BL/6 XID mice were inoculated with 1×10⁵ B16F10 melanoma cells subcutaneously. After two weeks of treatment mice were sacrificed and the frequency of GR-1+/CD11b+ MDSC in spleen was measured by flow cytometry. Values represented are means ± SE of MDSC from 5 mice for each treatment group, p = 0.73.

