Figure 4.
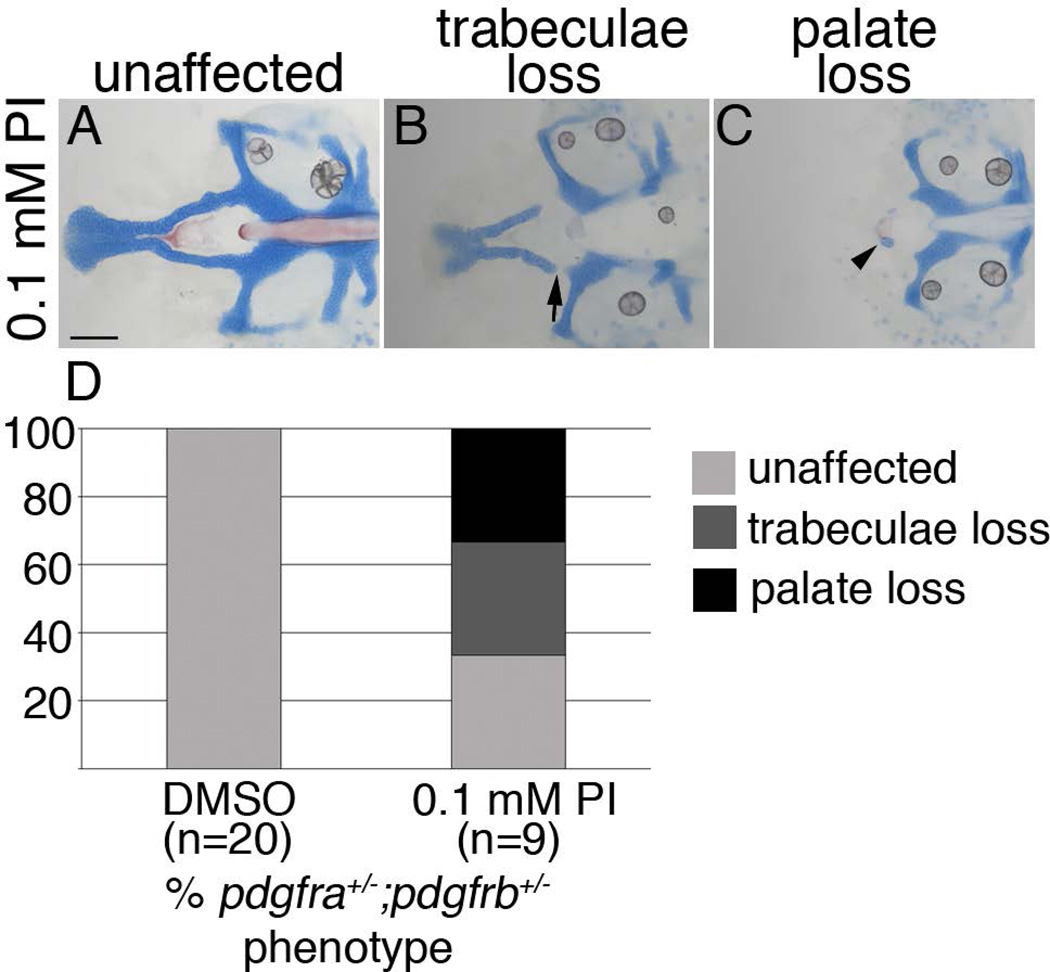
Craniofacial development is sensitive to Pdgf signaling loss between 10 and 30 hpf (A–C) 5 dpf flatmounted pdgfra+/−;pdgfrb+/− zebrafish neurocrania, exposed to 0.1 mM Pdgf Inhibitor V (PI) from 10 to 30 hpf, anterior to the left. (D) Bar chart depicting percentage of pdgfra+/−;pdgfrb+/− embryos displaying unaffected (light grey bar, A), trabeculae loss (dark grey bar, arrow in B), or palate loss (black bar, arrowhead in C) craniofacial defects in DMSO or 0.1 mM Pdgf Inhibitor V (PI). scale bar= 20 µm.

