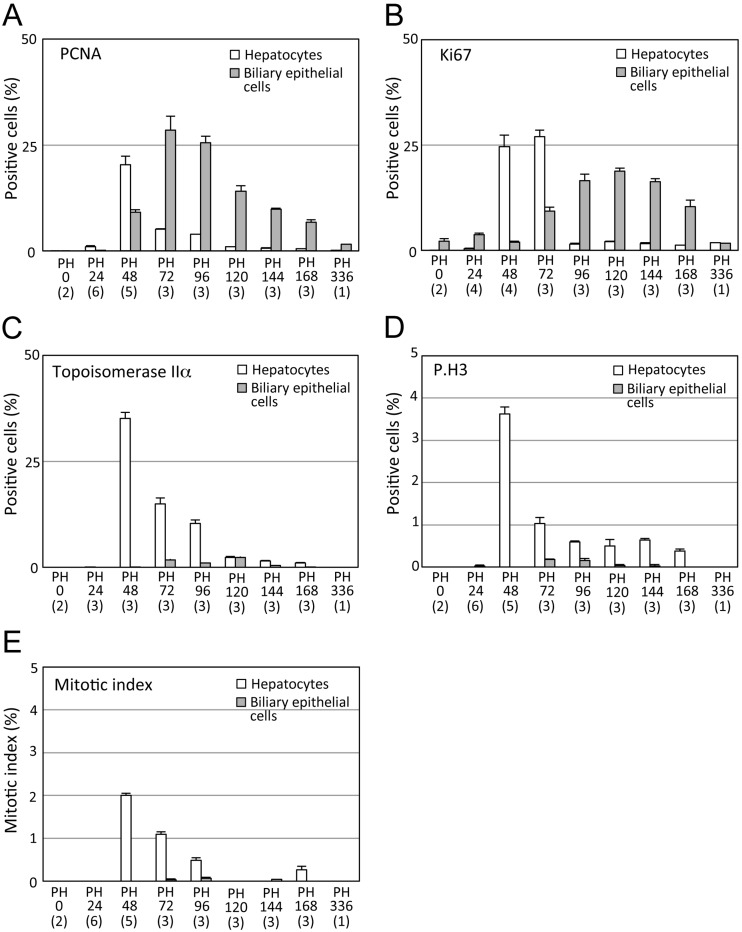
Fig. 1.
Cell cycle progression during mouse liver regeneration. A, Percentage of hepatocytes and biliary epithelial cells with PCNA-positive nuclei. B, Percentage of hepatocytes and biliary epithelial cells with Ki67-positive nuclei. C, Percentage of hepatocytes and biliary epithelial cells with topoisomerase IIα-positive nuclei. D, Percentage of hepatocytes and biliary epithelial cells with P.H3-positive nuclei. E, Mitotic index of hepatocytes and biliary epithelial cells. Over 1,000 cells per liver were counted. Data are shown as mean +/− standard deviation. While most hepatocytes semi-synchronously enter the S or M phase at PH48 and PH72, biliary epithelial cells have delayed and slow cell cycle progression (A-E). The number in parentheses is the number of animals examined.

