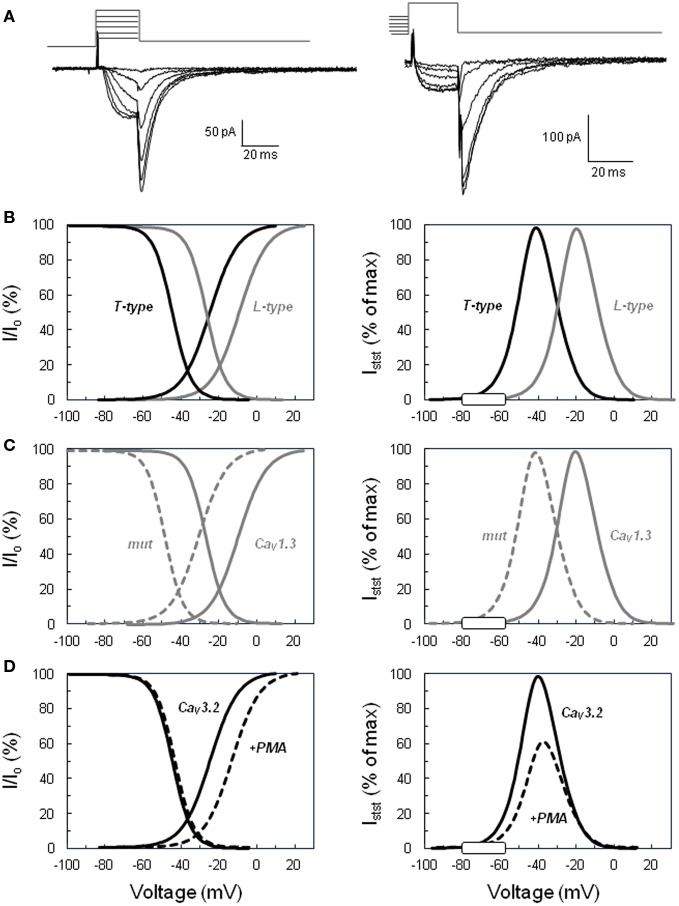
Figure 1.
Activation and inactivation of voltage-operated calcium channels and steady-state “window” currents. (A) Examples of slowly deactivating (T-type) Ba2+ currents recorded in the whole cell configuration of the patch clamp technique. Left. Voltage protocol for determining the activation curve: tail currents were evoked by repolarizing the cell to −65 mV after a short period (20 ms) of depolarization at various voltages (−45 to +5 mV for this selection of traces) from a holding potential of −90 mV. Right. Voltage protocol for determining the steady-state inactivation curve: tail currents were elicited in the same cell at −65 mV, but after steady-state inactivation of the channels for 10 s at various holding potentials (here from −80 to −30 mV) and 20 ms activation at +20 mV. Current amplitude upon cell repolarization was then determined by fitting tail currents to an exponential function (the time constant was approximately 7 ms). (B) Comparison of low (T-type) versus high (L-type) threshold voltage-operated calcium channels. Left panel shows normalized activation and inactivation curves determined for T-type channels using the same type of protocol as shown in panel A. Tail current amplitudes were plotted as a function of the test voltage, fitted to Boltzmann’s equation, and normalized to the maximal current (Io). Curves for L-type channels were similarly defined from L-current amplitudes determined with a different voltage protocol, including the inactivation of T currents. Right panel displays the calculated normalized steady-state current (Istst) expected through T-type and L-type channels within their respective permissive window of voltage. The theoretical steady-state currents were obtained from the activation and inactivation curves according to Ohm’s law and expressed as a percentage of the maximal current. The white rectangle on the voltage axis indicates the range of membrane potentials reached in naive glomerulosa cells and in cells stimulated with physiological concentrations of angiotensin II or extracellular potassium. (C) Effect of the Ile770Met mutation described in the CACNA1D L-type calcium channel (13) on the channel activation, inactivation, and steady-state current. Curves have been determined as in (B) for the wild-type channel (continuous line, CaV1.3) and for the mutant channel (dotted line, mut) and show the significant shift of the channel permissive window toward lower voltages. (D) Effect of PKC activation on CACNA1H T channel activation, inactivation, and steady-state current. Curves have been determined as in (B) for the naive channel (continuous line, CaV3.2) and for the channel in glomerulosa cells treated with the PKC activator phorbol 12 myristate 13-acetate ester (dotted line, +PMA) and show the significant reduction of the amplitude of the maximal steady-state current with the slight shift of the permissive window toward higher voltages. The graphs of this figure have been constructed based on data available in Ref. (14, 13).

