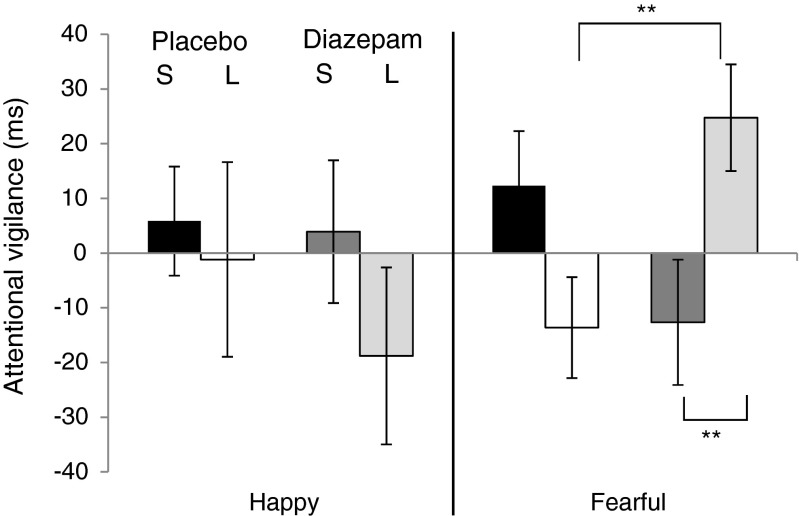
Fig. 1.
Attentional dot probe. Figure shows attentional vigilance scores [median reaction time (ms) congruent trials–median reaction time (ms) incongruent trials] for placebo-treated group with 1000-ms stimulus presentation (black) and 500-ms stimulus presentation (white) and drug-treated group with 1000-ms stimulus presentation (dark grey) and 500-ms stimulus presentation (light grey). S short duration, L long duration. Error bars show standard error. **p < 0.01, denoting simple main effect of group within long duration at the top of figure and simple main effect of duration within drug group at the bottom

