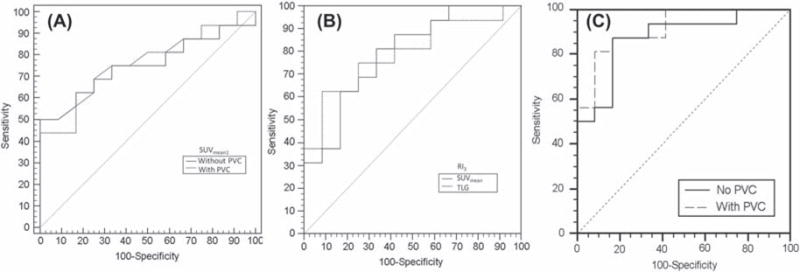
Figure 2.

ROCs examples for prediction of non-responders (n = 16), using (A) SUVmean with or without PVC, (B) TLG and SUVmean RI3, and (C) logistic regression combining baseline MATV and SUVmean values and their evolution after 8 and 15 days, with and without PVC.
