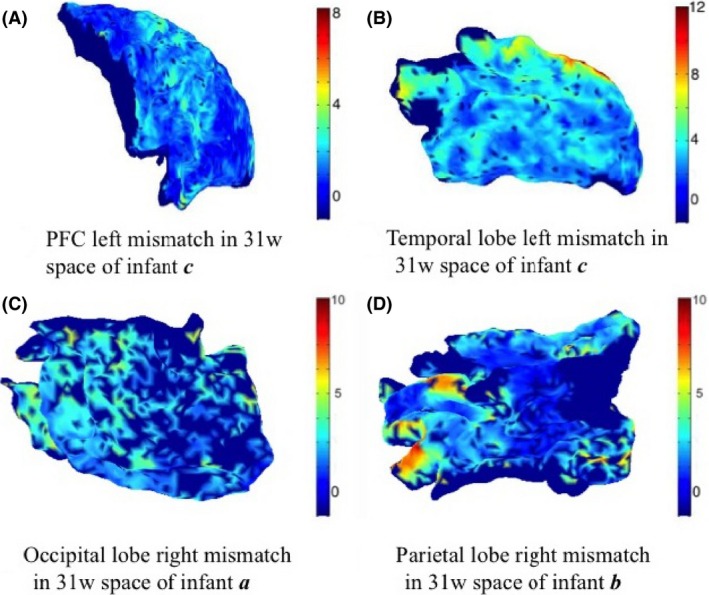
Figure 4.

Example maps of mismatching variation between the whole‐brain matching and regional spectral matching correspondences (units are in mm). Vertices that are not represented in both individual and whole‐brain meshes were attributed a value of −1 (represented with dark blue).
