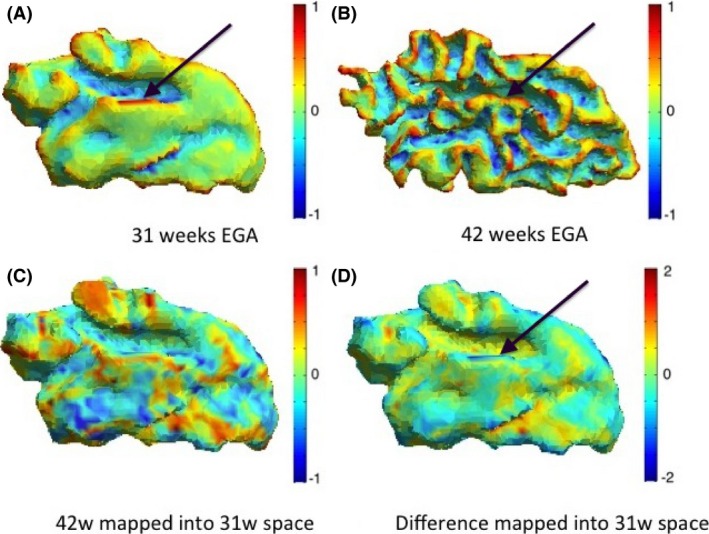
Figure 9.

Maps of mean curvature of the grey–white matter boundary of the temporal lobe (left) for infant c scanned at 31 weeks (A) and 42 weeks (B) EGA. Positive values (red/yellow) represent gyri (convex structures) and negative values (blue) represent sulci (concave structures). The Joint‐Spectral Matching correspondence allows us to map mean curvatures from 42‐week to 31‐week space (C) and compute the changes in mean curvature between these two time points in 31 weeks space (D). The black arrow indicates the transverse temporal gyrus, which becomes definite around 31 weeks of gestation and therefore all other secondary and tertiary gyri surrounding it will emerge during the preterm period.
