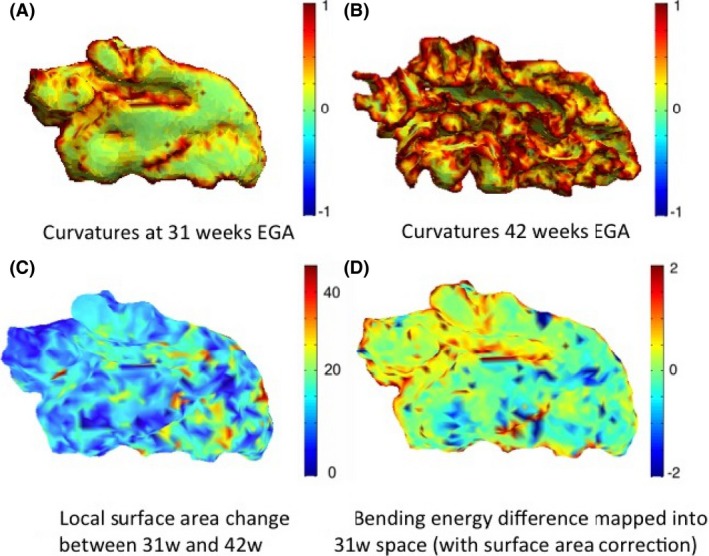
Figure 10.

Total curvature of the white–grey matter boundary of the temporal lobe (left) shown for infant c at 31 weeks (A) and 42 weeks (B) EGA, local surface area change between the two time points (C), and computed bending energy (D). Positive values (red) in the bending energy represent regions of gyrification, and negative values (blue) represent regions of sulcation.
