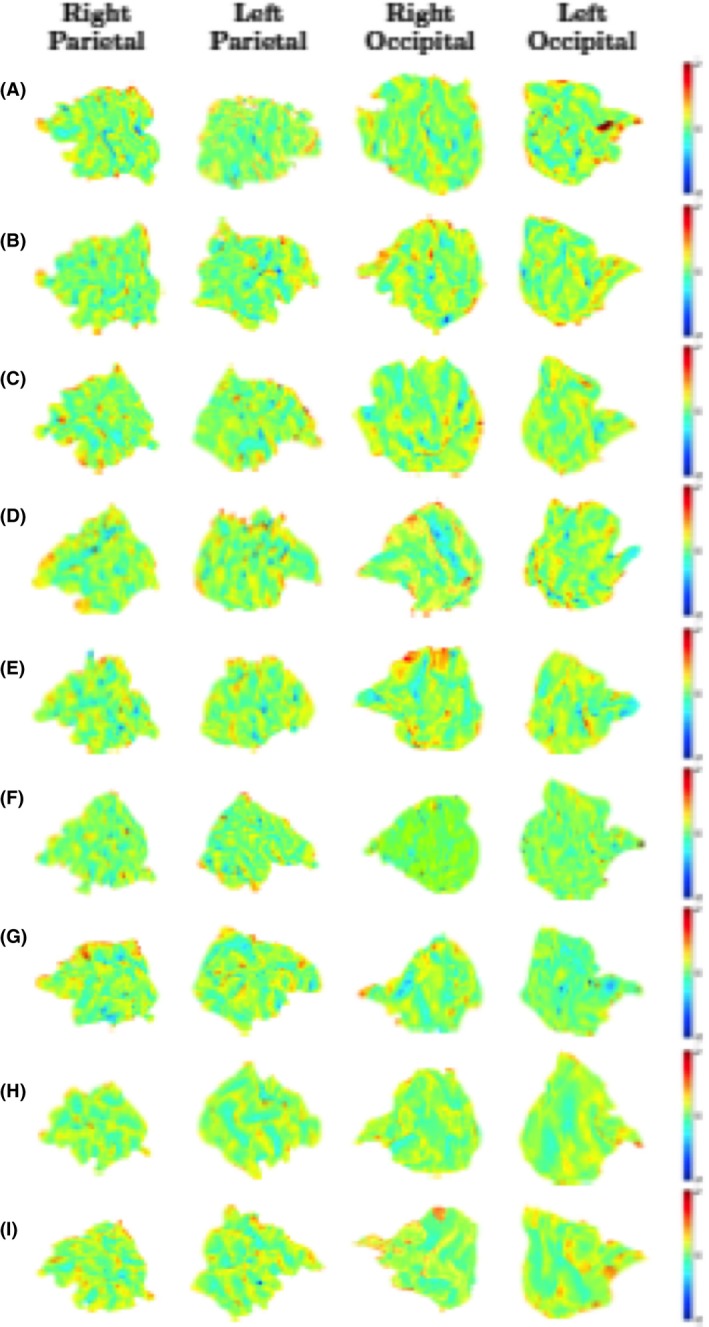
Figure 13.

Changes in the intrasubject mean curvature mapped into the earlier scan using Joint‐Spectral Matching for all nine infants. For each infant (A–I) we show the mean curvature changes in the regions we looked at: right parietal lobe (first column), left parietal lobe (second column), right occipital lobe (third column), and left occipital lobe (fourth column). Positive values (red/yellow) represent gyri (convex structures) and negative values (blue) represent sulci (concave structures).
