Figure 14.

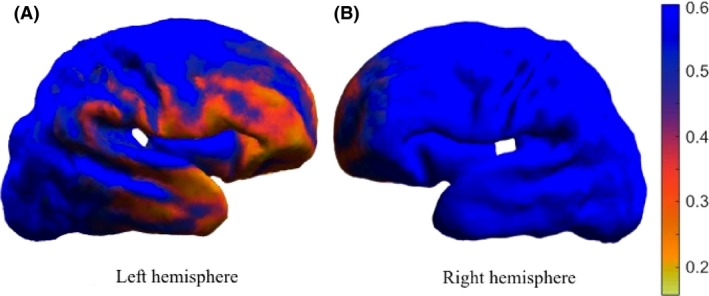
Statistical maps of longitudinal differences during the preterm period in nine infants of the left and right hemisphere. The P‐values are described by the color bar.

Statistical maps of longitudinal differences during the preterm period in nine infants of the left and right hemisphere. The P‐values are described by the color bar.