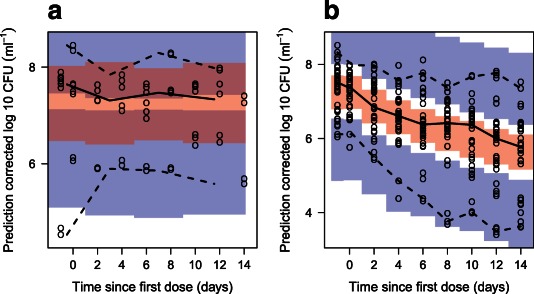
Figure 2.

Prediction‐corrected visual predictive check of the final model stratified on presence of drug in which (a) is the group that received no drug and (b) is all groups that received drug. The solid and dashed lines are the median, 2.5th, and 97.5th percentiles of the observed data, respectively. The shaded areas (top to bottom) are the 95% confidence intervals of the 97.5th (blue), median (red), and 2.5th (blue) percentiles of the simulated data. Open circles are prediction‐corrected observations.
