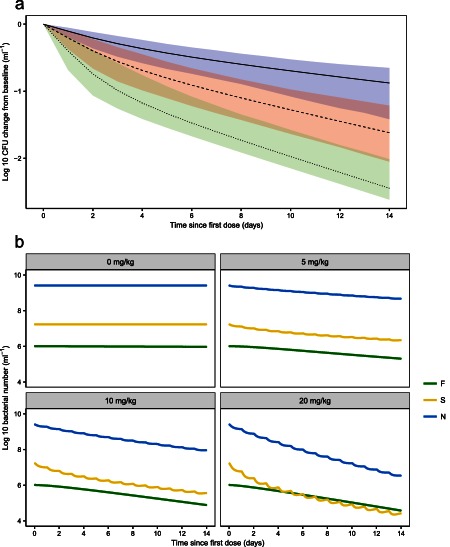
Figure 3.

Typical model predictions from the final Multistate Tuberculosis Pharmacometric model of (a) log‐10 change from baseline in colony forming unit (CFU) after daily rifampicin doses of 5 mg/kg body weight (solid black line, blue shaded area is the 95% prediction interval [PI], including model uncertainty), 10 mg/kg body weight (dashed black line, red shaded area is the 95% PI, including model uncertainty), and 20 mg/kg body weight (dotted black line, green shaded area is the 95% PI, including model uncertainty) and (b) model predicted typical bacterial number of the fast‐ (green), slow‐ (yellow), and nonmultiplying (blue) states, denoted F, S, and N, respectively, following different daily doses of rifampicin per kg body weight.
