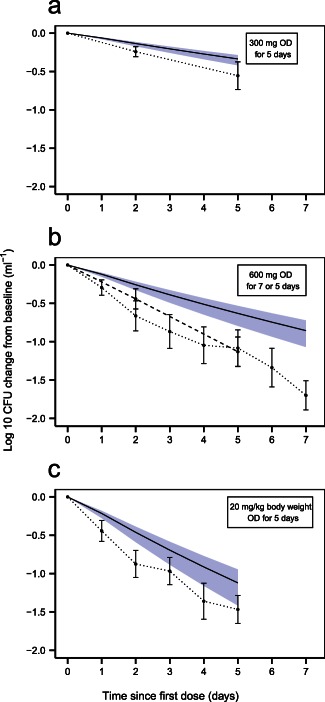
Figure 5.

Clinical trial simulations using an alternative two‐state model without inclusion of a nonmultiplying state. Log‐10 colony forming unit (CFU) in mL− 1 change from baseline vs. time since first dose of rifampicin for (a) 300 mg of rifampicin given once daily (OD) for 5 days28; (b) 600 mg rifampicin given OD for 5 (dashed line) and 7 (dotted line) days26,27; (c) 20 mg rifampicin per kg body weight given OD for 5 days.27 Shaded areas are the 95% confidence interval for the typical prediction of log‐10 CFU (mL− 1) change from baseline vs. time since first dose from 1,000 samples simulated with parameter uncertainty. Solid lines are the typical predictions from the model without a nonmultiplying state for the study design indicated in the top right box in each graph. Dots are the mean values at each designated time point with SEs shown as error bars. The dots are connected with dotted and/or dashed lines.
