Figure 5.

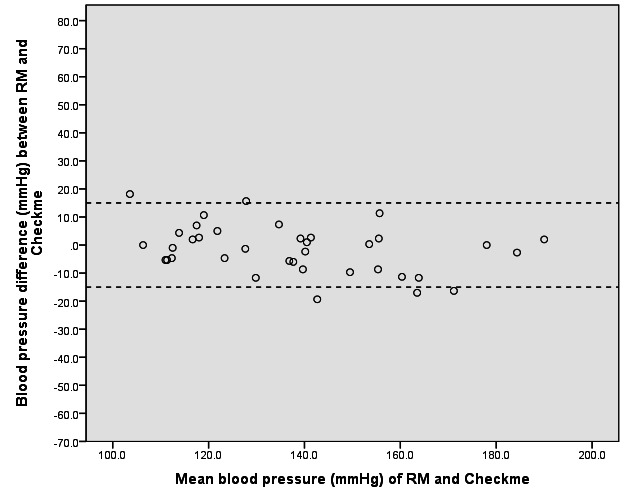
Bland-Altman plot of the difference in systolic blood pressure readings between the reference monitor (RM) and the Checkme Health Monitor (at heart level) in the supine position.

Bland-Altman plot of the difference in systolic blood pressure readings between the reference monitor (RM) and the Checkme Health Monitor (at heart level) in the supine position.