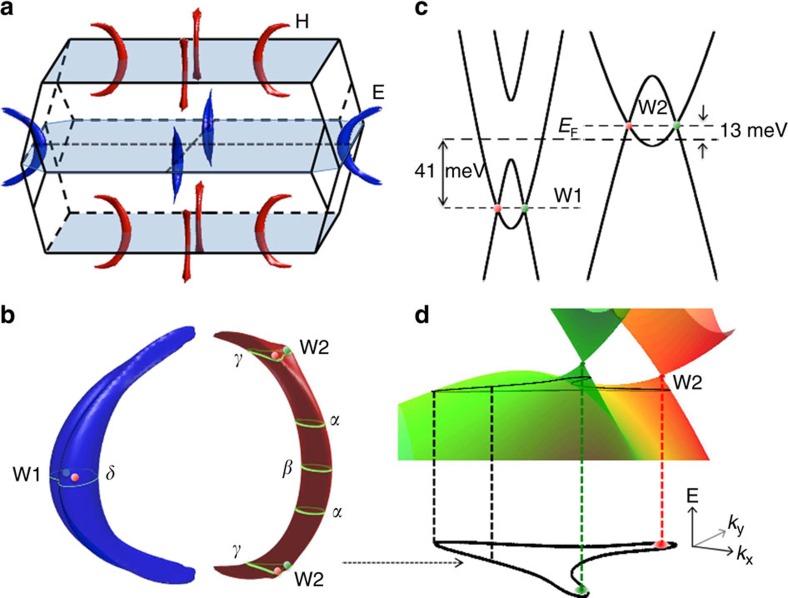
Figure 3. 3D Fermi surface pockets and Weyl points.
(a) Fermi pockets in the first BZ at the Fermi energy (EF) detected in the experiment. The electron (E) and hole (H) pockets are represented by blue and red colours, respectively. (b) Enlargement of the banana-shaped E and H-pockets. The pink and green points indicate the Weyl points with opposite chirality. W1- and W2-type Weyl points can be found inside E and close to H-pockets, respectively. Green loops represent some extremal E and H cross-sections, corresponding to the oscillation frequencies measured, Fα,β,γ,δ for B||c. (c) Energy dispersion along the connecting line between a pair of Weyl points with opposite chirality for W1 (left) and W2 (right). The deduced experimental EF (thick dashed horizontal line) is 13 meV below the W2 Weyl points and 41 meV above the W1 Weyl points. (d) Strongly anisotropic Weyl cones originating from a pair of W2-type Weyl points on the plane of Fγ. Green and red Weyl cones represent opposite chirality.

