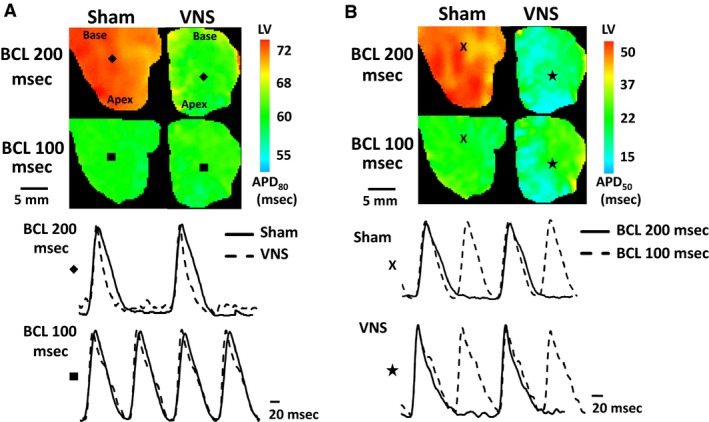
Figure 2.

Representative left ventricular (LV) action potential duration (APD) maps at basic cycle length (BCL) = 200 msec and 100 msec. (A) Examples of APD
80 maps with action potential traces from pixels “ ” and “
 ” for BCLs = 200 msec and 100 msec, respectively. (B) Examples of APD
50 maps with representative action potential traces from pixels “
 ”and “
 ”for Sham and VNS, respectively.
