
Figure 3.
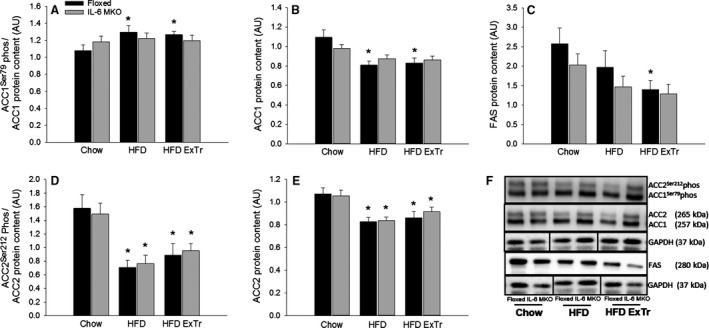
Hepatic ACC1Ser79 phosphorylation normalized to ACC1 protein content (A), ACC1 protein content (B), FAS protein content (C), ACC2Ser212 phosphorylation normalized to ACC2 protein content (D), ACC2 protein content (E) and representative blots (F) in Floxed and IL‐6 MKO mice after 16 weeks on Chow, HFD or HFD with exercise training (n = 9–10). Values are mean ± SE. *Significantly different from Chow within given genotype (P < 0.05).