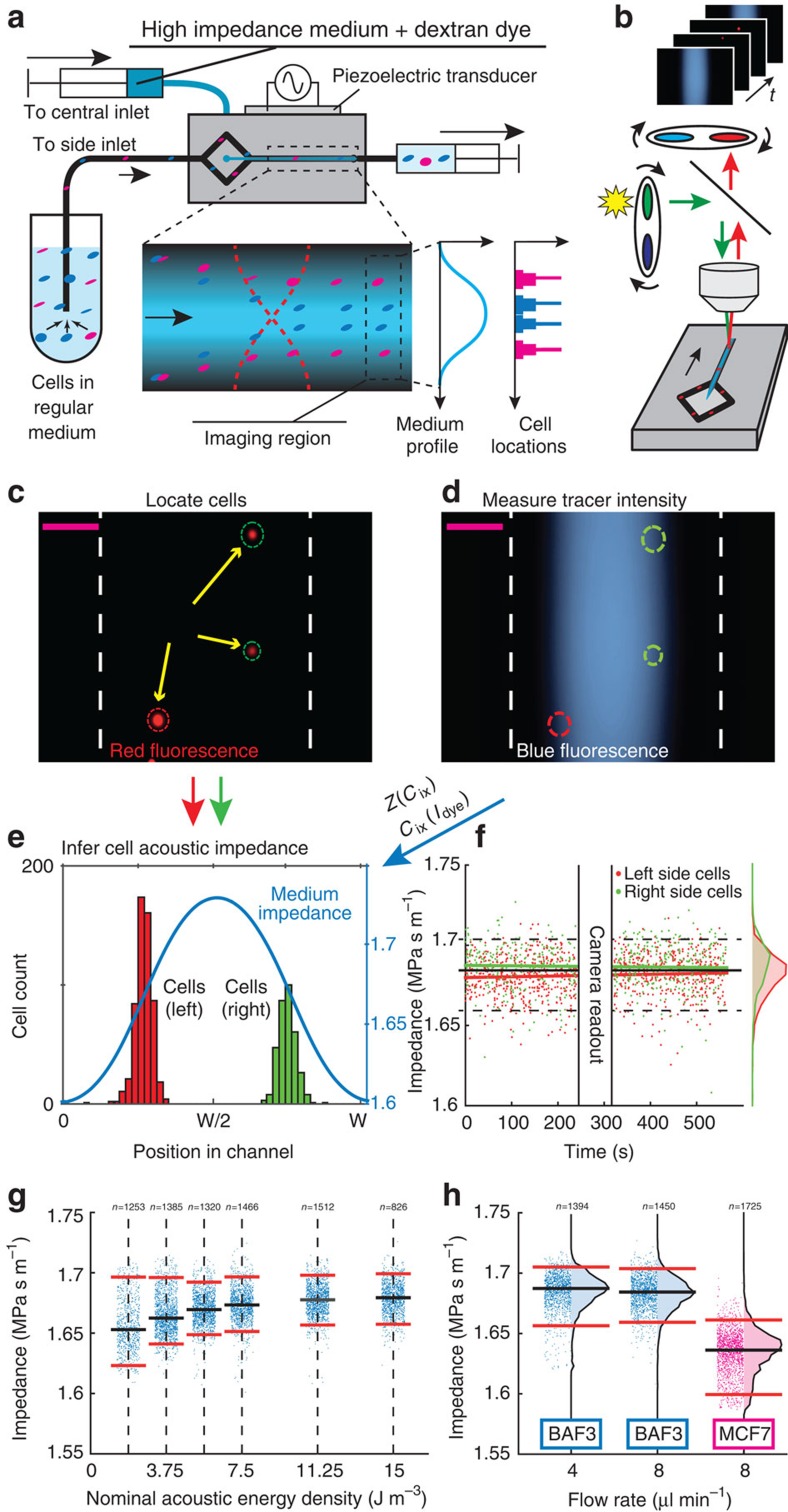
Figure 4. IAF cell measurements.
(a) Schematic of the system. (b-e) The acoustic impedance gradient is inferred via (b) sequential imaging at the end of the channel of (c) cells and (d) the fluorescent dextran tracer gradient. Scale bars (magenta) are 100 μm. (e) Standard solutions of iodixanol and dextran dye were analyzed to convert from fluorescence intensity to acoustic impedance. (f) Scatter plot during 500 s of the inferred acoustic impedance Zcell of BA-F3 cells (n=1,450) passing the imaging region in both sides of the device. The red and green lines show the linear least square fits. The solid black horizontal line shows the median of all cells and the dashed lines show the 5th and 95th percentiles. (g) Scatter plots of Zcell for BA-F3 (n=7,762) for six values of the acoustic energy density. (h) Scatter plots of Zcell for BA-F3 cells at flow rates 4 μl min−1 (n=1,394) and 8 μl min−1 (n=1,450) and for MCF7 cells at 8 μl min−1 (n=1,725). Black horizontal lines show median and red lines show the 5th and 95th percentiles.

