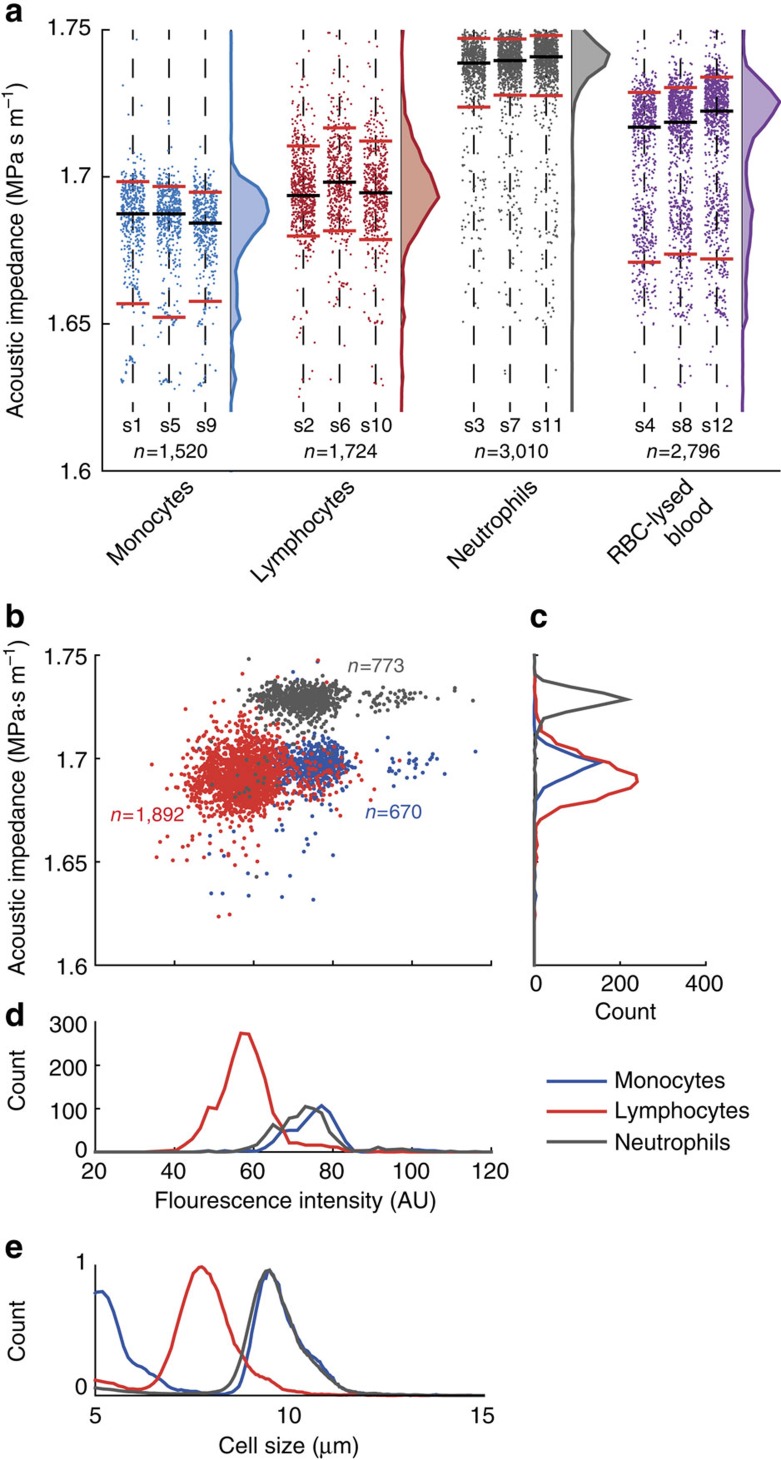
Figure 5. The effective acoustic impedance of white blood cells as measured by their IAP in an iodixanol gradient.
(a) Scatter plots containing 9050 data points of subsequent measurements of pre-enriched monocytes (blue), lymphocytes (red) and neutrophils (gray) isolated by negative depletion, and of white blood cells isolated by RBC-lysis of whole blood from a single donor. Labels s1 to s12 indicate the order of the sample analysis. Distributions show the sum of all measured cells for the three repeats. Black horizontal lines show the median and red lines show the 5th and 95th percentiles. (b) Scatter plots of the measured effective acoustic impedance vs fluorescence intensity of pre-enriched monocytes, lymphocytes and neutrophils from a second donor, and the distributions of (c) the effective acoustic impedance and (d) fluorescence intensity. (e) Size distributions of monocytes, lymphocytes and neutrophils as measured independently based on electrical resistance sizing (Coulter-counter).

