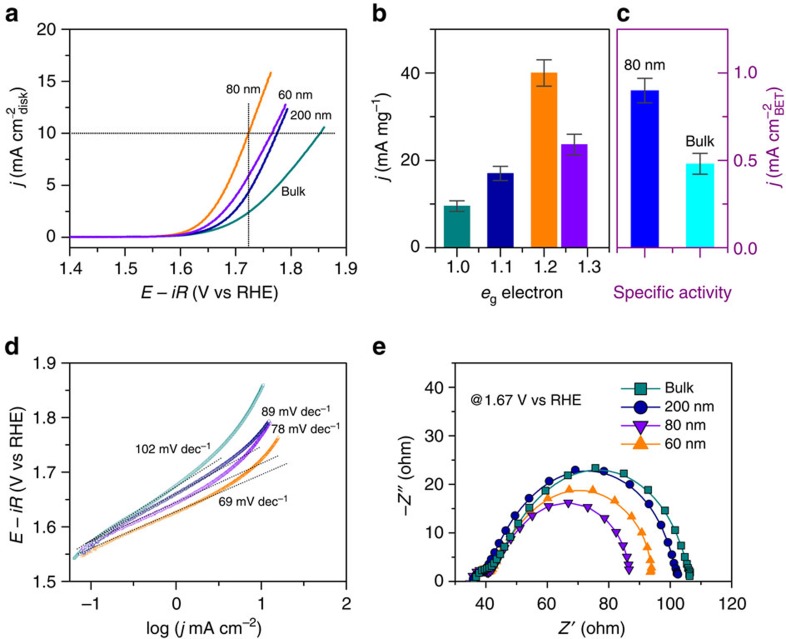
Figure 3. OER activities of the bulk and nanosized LCO.
(a) Polarization curves of the bulk and nanosized LCO. (b) Mass and (c) special activities at η=0.49 V. (d) Tafel plots for the bulk and nanosized LCO. (e) Nyquist plots for the bulk and nanosized LCO. Error bars represent the s.d. from at least three independent measurements.

