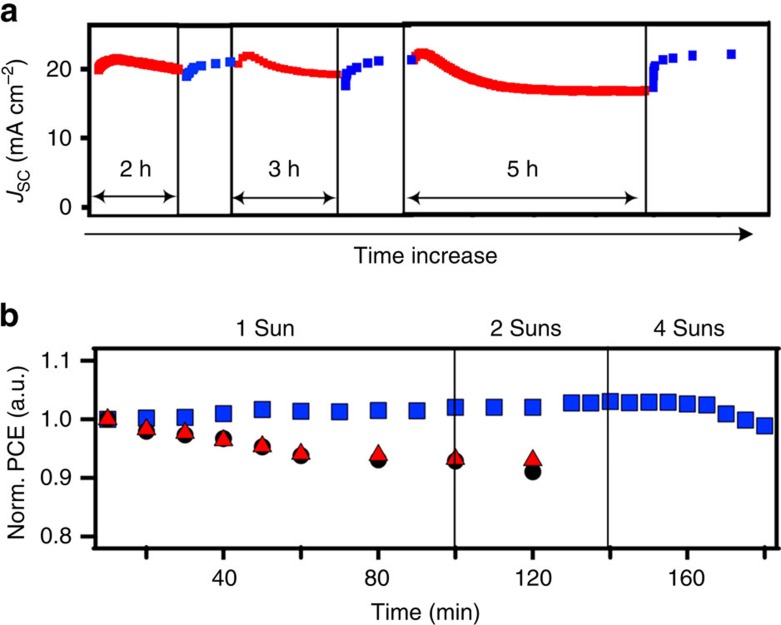
Figure 6. Practical implications for stable and repeatable solar cell performance.
(a) Multi-cycles of device degradation/recovery over 1 day by turning light on (red symbols) and off (blue symbols). (b) Normalized PCE under constant illumination by keeping the device operating at 0 °C (blue squares) and 70 °C (red triangles) as compared with device measured at room temperature (black circles).

