Figure 1.

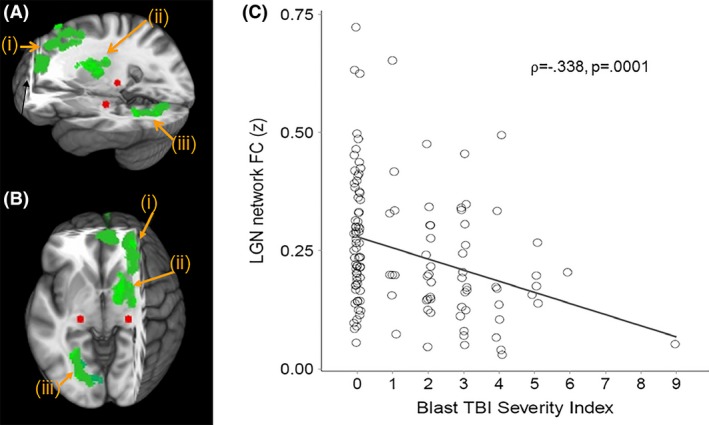
(A) Sagittal and (B) Axial views of three‐dimensional MNI brain with slices cut at x = −27, y = −3, z = −55, showing clusters with significant correlation with Blast mTBI Severity Scores and FC between lateral geniculate nucleus (LGN; red) and (i) dorsolateral and medial prefrontal cortex (BA 9 and 10), (ii) right ventral anterior nucleus of the thalamus, and (iii) lingual gyrus (BA 19). (C) Scatter plot showing significant correlation between Blast mTBI Severity Index scores and averaged LGN FC to green clusters (i, ii, and iii above). MNI, Montreal Neurological Institute; FC, functional connectivity; LGN, lateral geniculate nucleus; mTBI, Mild Traumatic brain injury; BA: Brodmann Area.
