
Figure 4.
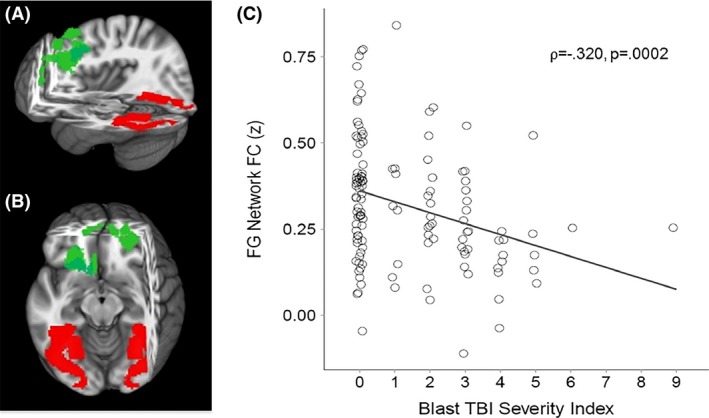
(A) Sagittal and (B) Axial views of three‐dimensional MNI brain with slices cut at x = −4, y = −34, z = −7, showing regions with significant correlation between Blast mTBI Severity Scores and FC between fusiform gyrus (FG; red) and a frontal cluster (green) comprised of superior and medial frontal gyri (BA 8 and 9, respectively). (C) Scatter plot showing significant correlation between Blast mTBI Severity Index scores and FG‐frontal FC. MNI, Montreal Neurological Institute; FC, functional connectivity; mTBI, Mild Traumatic brain injury; BA, Brodmann Area.