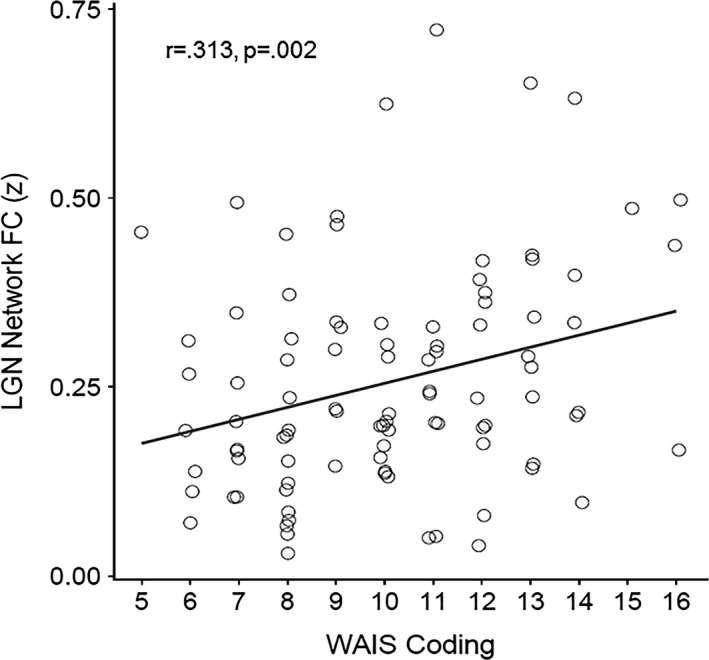
Figure 5.

Scatter plot showing significant correlation between WAIS Digit‐Symbol Coding task performance scores and mean LGN FC (with regions listed in Table 2). WAIS Coding performance is measured as the number of successfully completed pairings during the trial, transformed to age‐adjusted Scaled Scores (more pairings = better performance). LO and FG FC showed similar relationships with WAIS Coding scores (these scatter plots are not shown).
