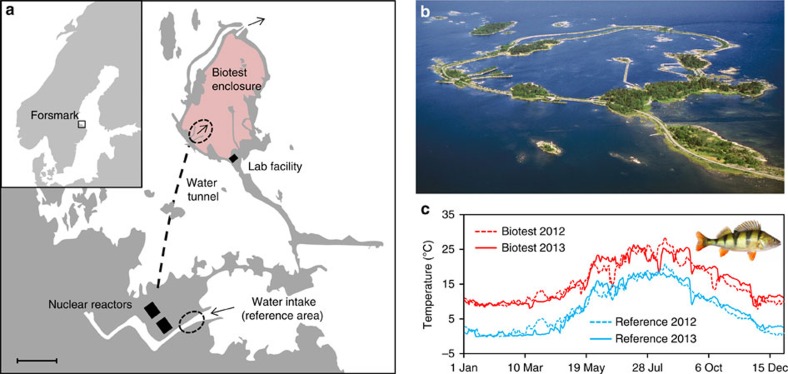
Figure 1. Biotest area overview and thermal conditions.
Schematic map (a) and aerial photograph (b) of the Biotest enclosure (Photo: Göran Hansson, used with permission). Depicted in a are the cooling water intake channel and tunnel under the seabed (hatched line) supplying heated cooling water into the Biotest enclosure. Hatched ellipses show areas where experimental fish were collected and the scale bar represents 500 m. The inset in a displays Scandinavia and the location of the experimental facility in Forsmark along the Swedish Baltic Sea coast (for further details see online supporting material). Panel c shows yearly temperature profiles with daily mean temperatures for the reference area (blue) and the Biotest enclosure (red) in 2012 (hatched lines) and 2013 (solid lines). Inset in c shows the experimental species European perch (Perca fluviatilis, L.; Photo: Fredrik Jutfelt, used with permission).

