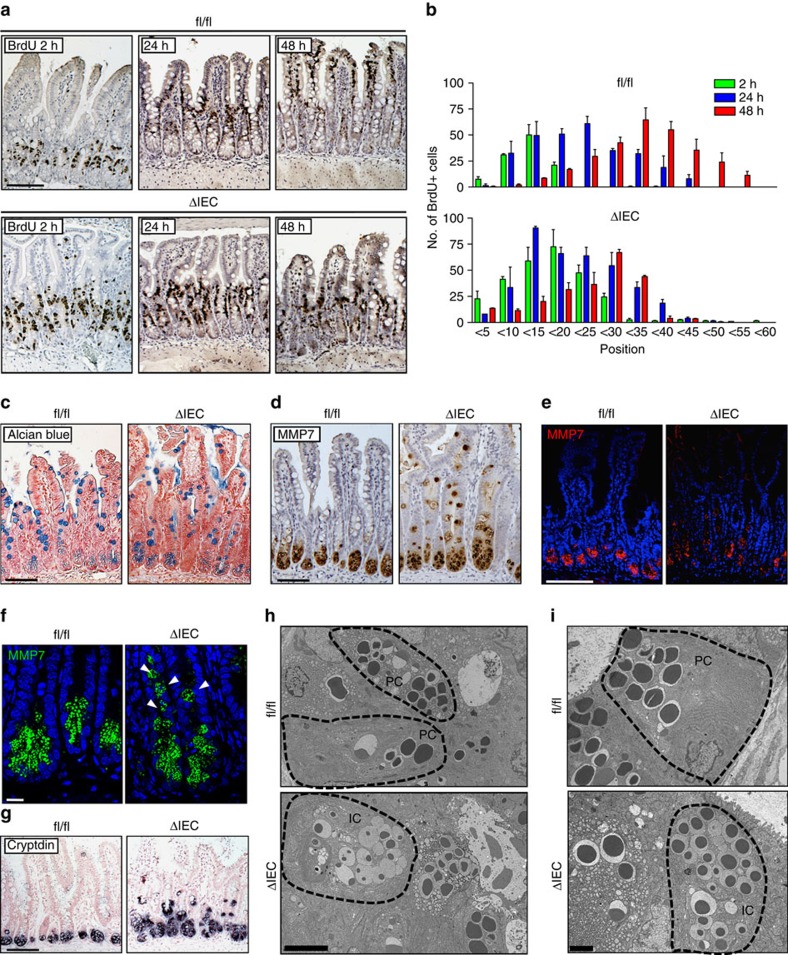
Figure 2. Abnormal IEC migration and secretory cell differentiation in Erk1/2ΔIEC mice.
(a–g) Comparison of ileum sections from fl/fl and ΔIEC mice 10 days after initiation of tamoxifen treatment. Representative examples from BrdU pulse-chase labelling experiments (2, 24 and 48 h) with ileum sections (a). Small intestinal sections without the aforementioned typical villous atrophy observed in ΔIEC mice were selected for the analysis. The position of BrdU-positive cells along the crypt–villus axis at 2 (green), 24 (blue) or 48 h (red) after injection (b). Results are mean±s.e.m. of 10 crypts (n=2 per group). Immunohistochemical staining for Alcian blue (c) and MMP7 (d). Immunofluorescent staining for MMP7 at low magnification to show crypts and villi (e), and at high magnification to show MMP7+ staining cells at the crypt base (f). Detection of Cryptdin transcripts by in situ hybridization; counter staining with nuclear red (g). (h,i), Ileum sections from fl/fl and ΔIEC mice 10 days after tamoxifen treatment were visualized by transmission electron microscopy (TEM). Ultrastructural features of secretory epithelial cells at the crypt base at × 2,500 magnification (h). Higher magnification of Paneth cells in the crypt at × 6300 magnification (i). IC, intermediate cell; PC, Paneth cell. Scale bars, 100 μm (a,c–e, g), 10 μm (f), 5 μm (h) or 2 μm (i).

