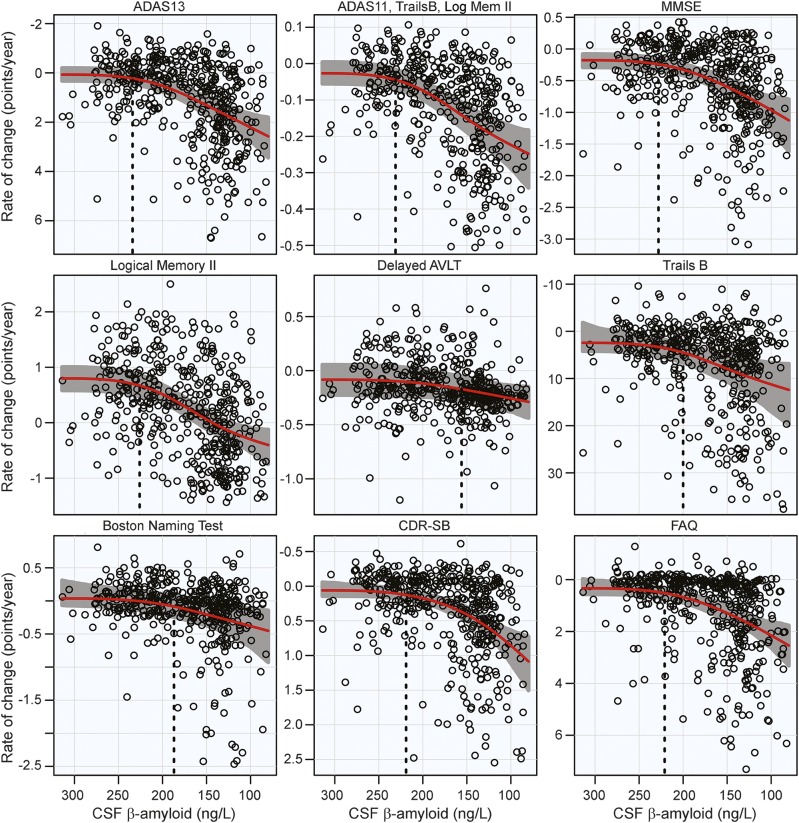
Figure 2. Cognitive and functional rates of change.
Annual rates of change for cognitive and functional measures are plotted against baseline CSF Aβ42. Rates of cognition or function worsen from top to bottom and β-amyloid pathology increases from left to right. Estimated curves are in red with 95% confidence intervals shaded in gray. The vertical dashed line in black is the estimate of the initial acceleration point. ADAS = Alzheimer's Disease Assessment Scale; AVLT = Auditory Verbal Learning Test; CDR-SB = Clinical Dementia Rating Sum of Boxes; FAQ = Functional Assessment Questionnaire; MMSE = Mini-Mental State Examination.

