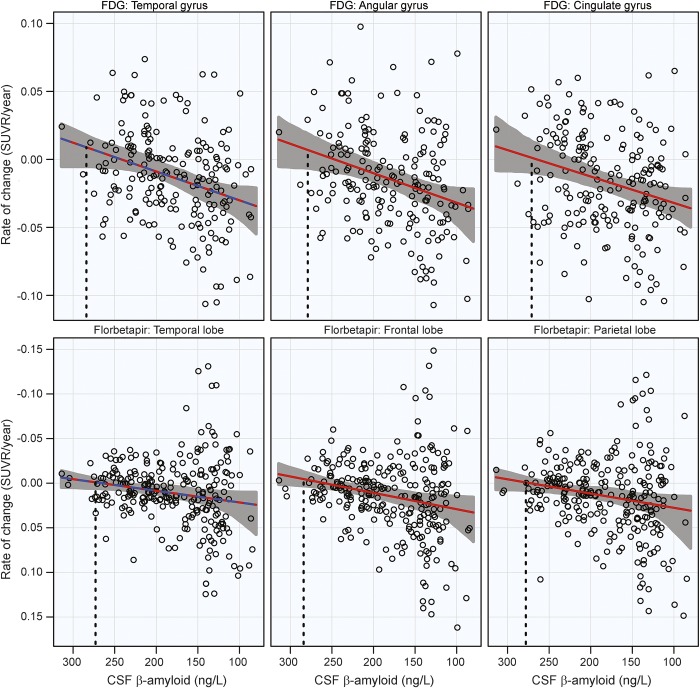
Figure 3. 18F-fluorodeoxyglucose (FDG) and florbetapir PET rates of change.
Annual rates of change for FDG PET (top row) and florbetapir (bottom row) are plotted against baseline CSF Aβ42. Rates worsen from top to bottom and β-amyloid pathology increases from left to right. Estimated curves are in red with 95% confidence intervals shaded in gray. The dashed blue line in the plot of the temporal lobe is the estimated curve without the monotonicity restriction, for comparison. The vertical dashed line in black is the estimate of the initial acceleration point. SUVR = standardized uptake value ratio.

