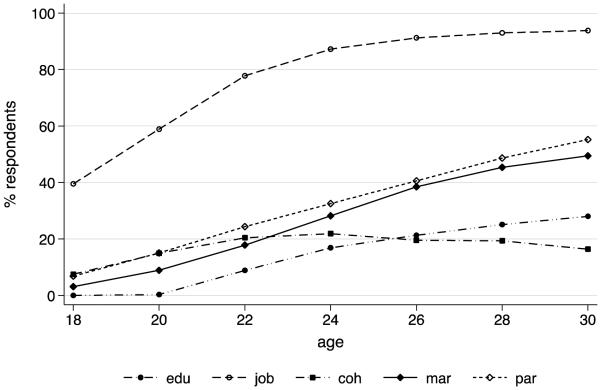
Figure 1. Percentage of respondents holding each adult role between the ages of 18 and 30 in two-year age intervals.
Edu = completed a four-year college degree or higher degree; job = obtained a full-time job; coh = cohabited; mar = married; par = had at least one child. Percentages are weighted using Add Health Waves I to IV sample weights.

