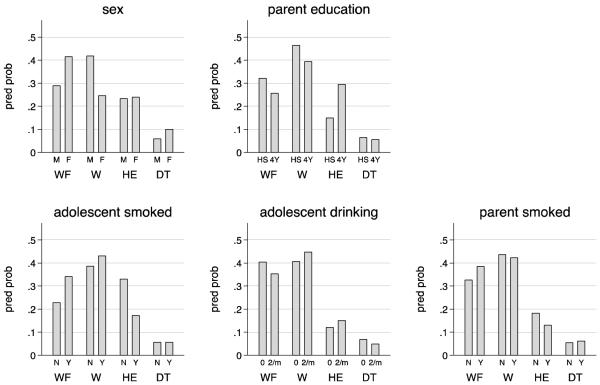
Figure 3. Predicted probabilities of pathway membership.
WF = work & family, W = work, HE = higher education, DT = delayed-transition. For sex M = male and F = female. For parent education HS = high school and 4Y = four-year college degree. For adolescent ever smoked daily and parent smoked N = no and Y = yes. For adolescent drinking 0 = never and 2/m = 2-3 times per month. The predicted probabilities were calculated using the estimates from the 4-pathway model within each complete data set and then averaged over the 20 complete data sets.

