FIGURE 3.
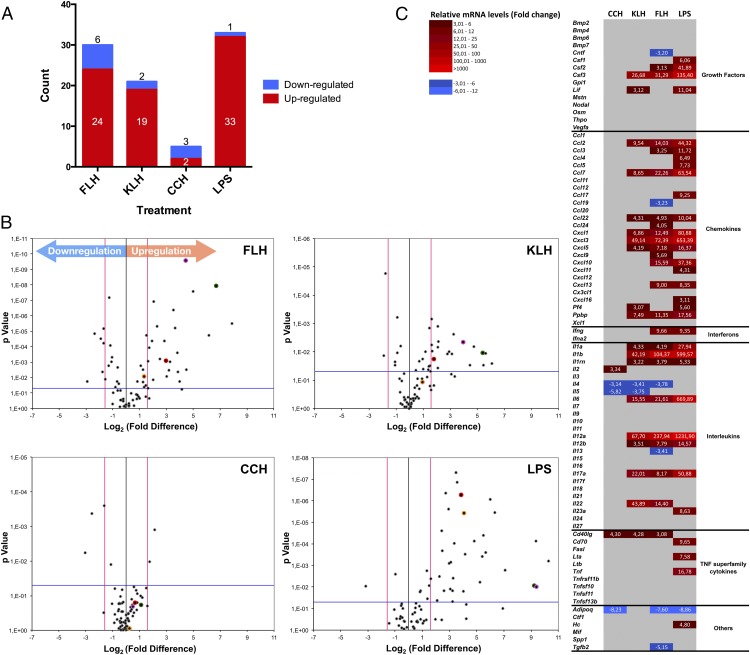
Hemocyanins induced the differential expression of cytokine genes in macrophages. Summary of the PCR array profile results for the expression of 84 cytokine genes analyzed using the RT2 Profiler PCR array is shown. This array includes chemokines, ILs, IFNs, growth factors, and TNF superfamily members. Macrophages were stimulated for 24 h with CCH, KLH, FLH (1 mg/ml), or LPS (100 ng/ml) as the positive control. Culture medium was used as the negative control. Reverse transcription quantitative PCR (RT-qPCR) data were analyzed using the ΔΔCt method. The criteria for a change in cytokine mRNA levels detected with the array were as follows: a Ct value of <33; a reaction efficiency of >55%; a melting curve profile corresponding to the specific amplicon; and a threshold fold change of >3-fold. (A) FLH induced a stronger proinflammatory response than did KLH or CCH. Graphic indicates the number of significantly upregulated (red) and downregulated (blue) genes for each treatment (FLH, KLH, CCH, and LPS). (B) Volcano plots. Differences in the expression of genes encoding the 84 inflammation-related factors are shown. Each dot in the plot represents one gene: the x-axis shows log2, indicating the biological impact (fold change in response to hemocyanin treatment [CCH, FLH, KLH] or LPS), whereas the y-axis shows −log10, indicating the statistical reliability of the fold change (p value). Gene markers of inflammation evaluated in the experiments of Fig. 2 are indicated by colored dots: IL-1β, green; IL-6, pink; TNF-α, yellow; and IL-12p40, red. (C) Heat maps. The figure displays mRNA expression levels in macrophages in response to hemocyanins. The map compares CCH, FLH, and KLH with the positive control LPS. Upregulated cytokines are represented in graded shades of red, and downregulated cytokines are shown in graded shades of blue. The data are representative of three independent experiments.

